Note: I am still in the process of accumulating the holdings of this portfolio. I have not bought all the stocks listed here. Refer to my disclosure for my current holdings.
As the end of 2013 approaches, it is time for me to conduct another portfolio review for my dividend portfolio. In my last portfolio review, I took two stocks out and added seven stocks (six companies and one fund) into my custom-made dividend portfolio- which you will be able to view in its entirety at the end of this article. In this review, I will summarize the changes in some of the metrics that I constantly watch to ensure the health of my portfolio, and some key changes in holdings.
Let us start by revising the strategy and goals of this portfolio.
Strategy And Goals
Name
Kang's Dividend Compounding Portfolio (KDCP)
Mission Statement/Goal
To provide myself with capital appreciation and a steadily growing stream of predictable and reliable dividends to be reinvested into their respective companies. I also aim for a portfolio that will yield around 4%, and expect the compounding, along with the returns in the stock price itself, to be able to beat both inflation and the major indexes over the years.
The Strategy
In addition to reinvesting the dividends paid out by a company, I plan to add at least $400 to the account every month. This will ensure that at least some money is contributed regularly to the dividend account for compounding over time.
Portfolio Management
In terms of portfolio management, I plan to be an active manager. By "active", I do not plan to trade actively. Instead, I plan to keep myself on top of the news, looking out for any signs that may not be favorable to me, and researching about new stocks that may be a good pick for my portfolio at the same time. One stock I found while researching this way was Textainer (TGH). Textainer is included in this dividend portfolio, and it has performed well on both the dividend growth and the price appreciation aspects.
Number Of Positions
I plan to hold between 25 and 33 positions in the portfolio, with every stock representing around 3- 4% of the portfolio. This number may change in the future if I want to expand my portfolio of holdings.
General Goals
I aim to remain diversified across industries and across nations, while maintaining beta below 0.7 (at least 30% less volatile than the general market). All companies must also be part of the Dividend CCCs list - which stand for Dividend Champions, Contenders and Challengers. This ensures that they have increased dividends for at least five consecutive years.
In terms of dividend growth, I require a company to keep dividends growing at a rate above 4% with the exceptions of stable utilities and already high-yielding REITs. Companies will also have to yield at least 2%. If not, I will redeploy the funds elsewhere.
In terms of dividend sustainability, payout ratios (based on either EPS or FFO for REITs and MLPs) for individual stocks have to stay below 90%, and EPS/FFO growth has to be sustained above the 3% mark.
Do find more of my buying, selling and general guidelines here and here.
2nd Half Summary
The 2nd half of 2013 has been good for the portfolio generally, with most stocks keeping to their dividend growth trajectory. Although this is the case, there has been two stocks facing problems increasing their dividends.
The first company I have identified is Intel (INTC). Intel has not increased its dividend for the past 6 quarters, maintaining its dividends at the 22.5 cent mark. Intel has previously been a fast grower, as proven by its impressive five and ten year dividend growth rates, which are at 14% and 27% respectively.
With this, I will put Intel on probation, and will wait for the Q2 of next year for a dividend increase. If the dividend is held steady by then, I will dump Intel and go for another technology company. One replacement idea I have at this point is Cisco (CSCO). Although Cisco has only increased its dividends for three consecutive years (dividend initiated in 2011), dividends has speedily increased from $0.24 in 2011, to $0.46 in 2012 and $0.68 this year.
The second I have identified is the GAMCO Global Gold and Natural Resourced Fund (GGN), the only fund I added half a year ago. The fund has already decreased dividends twice in the face of abysmal results and dividend cuts from gold miners. Although it has recently cut its dividend by 25%, it still yields nearly 12%- a satisfactory amount for me.
Performance and Other Metrics
The S&P 500 has increased 28.1% (not including dividends) so far this year. My dividend portfolio's performance so far is 20.9% (not including dividends), which the best performer being Lockheed Martin (LMT), returning 54.0% so far and the worst performer being Digital Realty (DLR), returning (-31.1%) to date. Although the portfolio has slightly underperformed the major indexes, this underperformance is normal considering the portfolio's lower beta.
The portfolio started this year yielding 4.2% with a beta of 0.68. With the addition of some higher yielding entities, the portfolio currently yields 4.25% while having a lower beta of 0.655. Although this is the case, the portfolio's P/E ratio has increased from the 15 range last year to the 16.1 currently. This is a sizeable increase in valuation, but the new figure is still acceptable to me.
The average 5-year dividend growth rate stands at 10.8% with the average year-over-year dividend increase being 9.5%. This beats inflation hands down, which is one of my most basic targets. The portfolio's average payout ratio stands at 59.8%, which points to the possibility of further future dividend growth.
Changes In Holdings
Replacing Aflac (AFL ) with Realty Income (O)
The first change I am going to make is to switch Aflac for Realty Income. I know that this move was rather unexpected- after all, I had written an article here previously talking about why I like Aflac. Here are the main reasons for the switch:
Firstly, Aflac does not have a high dividend yield. Currently yielding only 2.23%, Aflac is the second lowest yielder in the portfolio. Therefore, I wanted to redeploy the funds to another higher yielding entity.
Secondly, Aflac has an evidently slowing dividend growth rate. I had first spotted this recently while reviewing Aflac's past dividends. Aflac had increased dividends at a compounded rate of 10.9% over the past 5 years, and over the past 10 years, dividends grew at an even more impressive 19% clip. Although this is the case, Aflac grew its dividends at only 5.7% this year, which draws it close to my minimum requirement for dividend growth- 4%. This, coupled with its lower-than-average dividend yield, made me sell my stake in Aflac.
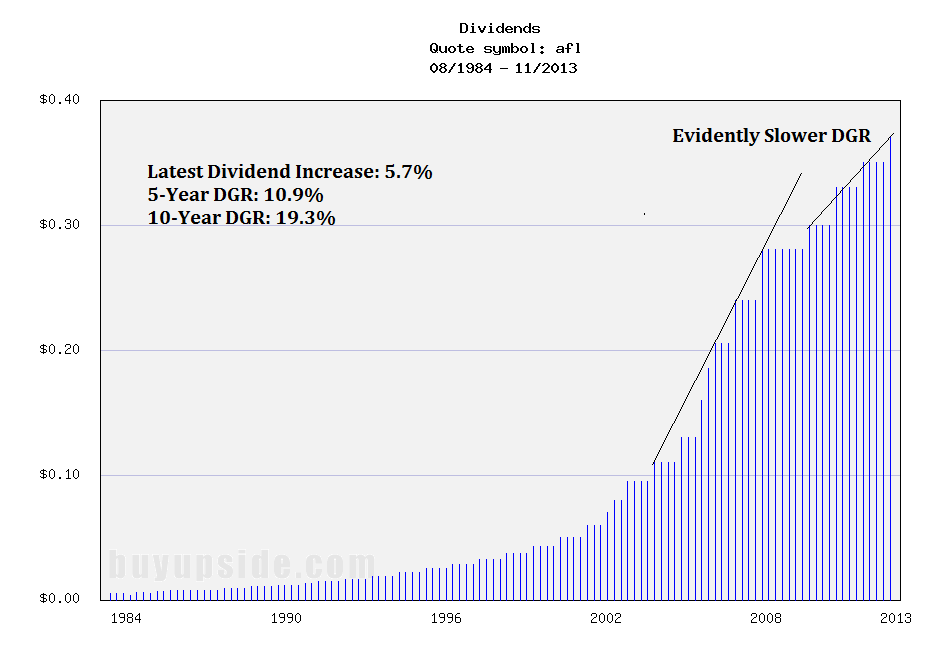
(Click to enlarge)
On the other hand, Realty Income is one of the best blue-chip triple net REITs around. In addition to its high 5.9% yield at the moment, Realty Income shares are trading near the 15x FFO "fair value" mark of $36, representing a good opportunity for an acquisition of shares.
Although Realty Income's dividend growth is slow most of the time, growing dividends at around 2% per annum on average, it does treat investors with a larger bump-up in dividends occasionally, which can be seen from the dividend chart below. For example, Realty Income increased dividends by around 20% for 2013- one of its largest dividend increases ever.
These steady dividend increases, coupled with occasional boosts, will provide me with the necessary dividend growth (around 4%) to meet my aim of beating inflation over the long term.

(Click to enlarge)
Replacing Lorillard (LO) with Philip Morris (PM)
The second change I am making is to replace Lorillard with Philip Morris. The main reasons for this are below:
- Lorillard has seen slowing dividend growth, while Philip Morris has maintained above-average dividend growth
This situation is similar to the one with Aflac as shown above. Lorillard's dividends has grown in the high teens for both the three and five year periods, since its 2008 IPO. But, Lorillard only increased dividends by 6% this year, much to my disappointment. On the other hand, Philip Morris maintained its solid double-digit dividend growth it has seen since it was spun off from Altria (MO), increasing dividends by 10.6% in September.
- Philip Morris has both greater international exposure and brand recognition than Lorillard
Philip Morris operates in many markets across the globe, making it a much more diversified pick as compared to Lorillard. In addition, Philip Morris has a large and strong brand portfolio with premium brands such as Marlboro and Parliament. These strengths has enabled it to weather uncertainties such as the European recession, allowing it to grow its market share even through difficult times.
Although Lorillard has a dominant position in the US menthol cigarette market, potential regulations against menthol cigarettes could still be detrimental towards both the company's top and bottom lines. This lack of diversification, both geographically and in terms of its range of products, also played a part in my decision to switch Lorillard for Philip Morris.
With this, I conclude the 2nd quarter summary for my portfolio. Here is the full portfolio for reference:
| # | Company | Consecutive Dividend Increases (Years) | Dividend Yield (%) | Latest DGR (yoy,%) | 5-Year DGR (%) |
| 1 | Alliance Resource (ARLP) | 11 | 6.2 | 8.3 | 13.6 |
| 2 | Altria | 45 | 5.2 | 9.1 | 14.3 |
| 3 | AT&T (T) | 29 | 5.2 | 2.3 | 4.3 |
| 4 | Automatic Data Processing (ADP) | 39 | 2.4 | 10.4 | 11.1 |
| 5 | Chevron (CVX) | 26 | 3.3 | 11.1 | 9.2 |
| 6 | Coca-Cola (KO) | 51 | 2.8 | 9.8 | 8.5 |
| 7 | Colgate-Palmolive (CL) | 50 | 2.1 | 9.7 | 11.8 |
| 8 | ConocoPhillips (COP) | 13 | 3.9 | 4.5 | 14.7 |
| 9 | Digital Realty | 9 | 6.9 | 6.8 | 20.1 |
| 10 | ExxonMobil (XOM) | 31 | 2.7 | 10.5 | 9.7 |
| 11 | General Mills (GIS) | 10 | 3.0 | 15.1 | 10.8 |
| 12 | Genuine Parts (GPC) | 57 | 2.6 | 8.6 | 6.3 |
| 13 | Intel | 10 | 3.8 | 7.1 | 14.0 |
| 14 | Johnson & Johnson (JNJ) | 51 | 2.8 | 8.2 | 8.2 |
| 15 | Kimberly Clark (KMB) | 41 | 3.1 | 9.5 | 7.0 |
| 16 | Kinder Morgan Mgmt (KMR) | 17 | 7.2 | 7.1 | 7.4 |
| 17 | Kraft Foods Grp (KRFT) | 1 (Spin-off from previous dividend aristocrat KFT) | 4.0 | 5.0 | n/a |
| 18 | Lockheed Martin | 11 | 3.9 | 15.7 | 23.0 |
| 19 | McDonald's (MCD) | 38 | 3.4 | 5.2 | 13.9 |
| 20 | Nestle (OTCPK:NSRGY)* | 17 | 3.0 | 5.1 | 7.9 |
| 21 | Novartis (NVS)* | 16 | 3.2 | 2.2 | 2.8 |
| 22 | Omega Healthcare (OHI) | 11 | 5.9 | 9.0 | 9.1 |
| 23 | Philip Morris | 6 | 4.4 | 10.6 | 11.7 |
| 24 | Procter & Gamble (PG) | 57 | 2.9 | 7.1 | 10.2 |
| 25 | Realty Income | 19 | 5.9 | 20.2 | 2.5 |
| 26 | Southern Company (SO) | 12 | 5.0 | 3.6 | 4.0 |
| 27 | Textainer (TGH) | 7 | 4.9 | 6.8 | 15.8 |
| 28 | Wal-Mart (WMT) | 39 | 2.3 | 18.1 | 12.6 |
| 29 | Wisconsin Energy (WEC) | 10 | 3.7 | 27.5 | 19.1 |
| Fund | |||||
| 30 | GAMCO Global Gold & NatRes Fund | - | 11.8 | - | - |
| AVERAGE | 25.3Yrs | 4.25% | 9.5% | 10.8% |
*Both Novartis and Nestle's DGR figures are denominated in the Swiss Franc (CHF)
Disclosure: I am long DLR, ARLP, INTC, KMR, TGH, CVX, XOM, MCD, JNJ, GGN, MO, T. I wrote this article myself, and it expresses my own opinions. I am not receiving compensation for it (other than from Seeking Alpha). I have no business relationship with any company whose stock is mentioned in this article. (More...)
This entry passed through the Full-Text RSS service — if this is your content and you're reading it on someone else's site, please read the FAQ at fivefilters.org/content-only/faq.php#publishers.
from SeekingAlpha.com: Home Page http://seekingalpha.com/article/1882311-my-income-portfolio-of-30-2nd-half-of-2013-review?source=feed
Aucun commentaire:
Enregistrer un commentaire