mardi 31 décembre 2013

How Much Should Twitter Be Worth And Should You Invest In It?

On Nov. 7th, shares of Twitter (TWTR) debuted on the NYSE at $45.10 per share and closed at a price of $44.90. Since then it has increased nearly 66% to a record high of $74.73 per share before falling to about $63.75 at the time of writing. This is equivalent to a gain of about 41% in less than two months, which I believe is mainly driven by market optimism instead of company growth.


While Twitter is a great company with a lot of growth opportunities in the U.S. and international market, I believe that the company's stock price is way ahead of its current intrinsic value which should be somewhere between $26 to $33 per share (or $14.4 to $18.3 billion in market cap). This will be explained below, but first we must understand how Twitter earns its revenues.


Twitter earns its revenues from two main sources: advertising revenues through promoted products and data licensing.


In the nine months ended Sept. 30, 2013, advertising revenues contributed 89% of Twitter's total revenue, while data licensing contributed the remaining 11%. The company expects that it will continue to make the majority of its revenue from advertising.


Since Twitter has not made any profits to date, I used the Price-to-Sales Ratio to estimate Twitter's current intrinsic value instead of a Discounted Cash Flow model (see image below):


click to enlarge


The intrinsic value calculation is based on these assumptions:


  • Twitter's timeline views will grow at about 35% each year in the next five years.

  • Average ad revenues per 1,000 timeline views will be $0.84. This number should increase over time as Twitter improves its ad platform, but I decided to use a conservative number based on the average ad revenues per 1,000 Timeline Views from the last four quarters (Source: Twitter S-1 form).

  • Data licensing revenue is about 10% of ad revenues each year.

  • The Price/Sales ratio starts at 25, which was the P/S when Facebook launched its IPO. This number is assumed to decline over time.


Based on my calculations and estimates, Twitter's intrinsic value should be around $14.4 billion in 2013 and should increase to about $45.1 billion in 2018 as the company continues to attract more Monthly Active Users (MAU), timeline views and Ad revenues through promoted products (e.g. promoted accounts, tweets and trends). If this intrinsic valuation is correct, it would mean that Twitter's current market cap of about $35 billion--at the time of writing--is overvalued; in other words, its current market cap is about four years ahead of its current intrinsic value.


I believe that Twitter is a great company that will do well in the long term because it has a great business model that attracts an increasing number of users around the world and many platform partners such as news media. In addition, live content via tweets can spread much faster on Twitter than on Facebook (FB) and Google (GOOG). Twitter's ad platform is also as competitive as Facebook's, despite having less users. As of Sept. 30, 2013, Twitter had around 230 million monthly active users while Facebook had around 1.19 billion.


However, investors should take caution if they decide to invest in Twitter because the stock is currently traded at a premium price. And it will likely take the company several years before its intrinsic business value can catch up to $35 billion in market cap.


As Benjamin Graham once stated: "The price is what you pay. Value is what you get."


Warren Buffett also said: "Be fearful when others are greedy and greedy when others are fearful."


These two quotes should apply to any stocks, especially those that are traded at a premium price.


Source: How Much Should Twitter Be Worth And Should You Invest In It?


Disclosure: I have no positions in any stocks mentioned, and no plans to initiate any positions within the next 72 hours. I wrote this article myself, and it expresses my own opinions. I am not receiving compensation for it. I have no business relationship with any company whose stock is mentioned in this article. (More...)


This entry passed through the Full-Text RSS service — if this is your content and you're reading it on someone else's site, please read the FAQ at fivefilters.org/content-only/faq.php#publishers.


Expect January Ill-Effects This Year


Stocks were up stupendously in 2013, and the gains were widespread, so I think this year we could feel a void as a result. The January Effect may instead yield the ill-effects of a previously stellar market performance. With little or no fuel to sustain stock buying, the market will more likely see the selling of shares on pushed forward tax gains in January. The actionable advice here, therefore, is to sell stocks as I also previously suggested in the article, Sell the SPY on High .


(click to enlarge)


Chart at Yahoo Finance


The charts of the SPDR S&P 500 (SPY), SPDR Dow Jones Industrial Average (DIA) and the PowerShares QQQ (QQQ) all show the amazing performance of the stock market this past year. The gains were astounding, as you can see via the table below. Netflix (NFLX) led all S&P 500 stocks higher, appreciating roughly 298%. The best performing stock sector was the Consumer Discretionary Sector, as evidenced here by the 41% gain of the XLY security. Still, the worst performing sector also rose this year. It was the telecom sector, and the performance of the iShares U.S. Telecommunications ETF (IYZ) still managed 22.5% appreciation.


Security


2013 Performance


SPDR S&P 500


29.7%


SPDR Dow Jones


26.7%


PowerShares QQQ


35.1%


Consumer Discretionary Select Sector SPDR (XLY)


40.9%


iShares U.S. Telecommunications ETF


22.5%


Netflix


297.6%


That's widespread appreciation, and it portends a less than stellar January, if not an outright downslide. Just 38 stocks from within the S&P 500 depreciated on the year. So where then will the funds from tax loss selling flow to fuel a January Effect? I believe that whatever fuel exists will be exhausted early in January, or has already been exhausted in late December's Santa Claus Rally.


Thus, stocks are in my opinion lacking positive seasonal catalyst in January, and given that stock market paper gains are aplenty, tax gain profit taking might occur. Such gains taken now instead of the end of 2013 allow investors to pay taxes in 2015. It's a cash flow factor that leads me to suggest that the stock market is more likely to decline in early 2014 than it is to rise. Thus, I suggest investors act preemptively and sell the market and especially richly valued shares like Twitter (TWTR) now. I suggested as much about Twitter and also about Alcatel-Lucent (ALU) in recent articles published here.


Source: Expect January Ill-Effects This Year


Disclosure: I have no positions in any stocks mentioned, and no plans to initiate any positions within the next 72 hours. I wrote this article myself, and it expresses my own opinions. I am not receiving compensation for it. I have no business relationship with any company whose stock is mentioned in this article. (More...)


Which Seeking Alpha App is best for you?


Seeking Alpha Portfolio


Tech Investor


ETF investor


Energy Investor


Email me a link to open from my phone:


PORTFOLIO


SymbolAlertsPriceChg% Chg


This entry passed through the Full-Text RSS service — if this is your content and you're reading it on someone else's site, please read the FAQ at fivefilters.org/content-only/faq.php#publishers.


After Hours Surprise From DryShips

On the last day of the Year, DryShips Inc. (DRYS) announced the resumption of the previous announced 200 Million (ATM)at the market offering. On December 5th, DryShips announced that they were suspending the offering signaling the way for an upward move in the stock. You can view my article here.


I stated at that time, I believed the company felt that the current stock price was too low. Subsequently the stock price climbed from $3.50 a share to a new yearly high of $5.00 on December 27th. In hindsight, that was the high of the year. So now what?


Good question, before the market panics, it is important to point out that shipping rates have been on the rise. There is no question that the timing of this move is suspect. The CEO has a bad reputation for exactly these types of moves. In my opinion, this is the main reason why the stock is not $7.50. The street has a hard time trusting the financial moves of this company's leader. As a long time holder of this stock, I too have suffered substantial financial loss from these various ATM offerings that have occurred over the last 3 years.


Here is the good news: the stock is up 34% since the announcement of the suspension. What does this mean for the shareholder? At a price of $4.45, which is the current after-hours price on December 31St, a follow on offering would amount to an increased float around 38.5M additional shares into the market. As frustrating as that is to shareholders, it is manageable.


The charts on DryShips and all shippers for that matter remains bullish. The economy is slowly improving. DryShips, with their majority owned Ocean Rig (UDW) is well positioned to capitalize on the continued growth in housing, and the need for dry bulk goods.


(click to enlarge)


DryShips made a huge run over the Christmas holiday, rallying from $3.69 on December 23rd, to $5 on December 27th. The whole sector made solid advances, with Eagle Bulk shipping Inc. (EGLE) rallying 9.8% today to close at $4.58. This calls into question, other shipping companies that will be in need of future funding. Both Genco Shipping and Trading LTD (GNK) and Eagle Bulk Shipping have recently seen their debt sold off to reduce certain bank's exposure to doubtful loans.


Conclusion


It may be a good idea to take some profits in shipping stocks. Pick your entry points and remain flexible to a changing environment.. Many shipping companies are still desperate to raise capital in order to survive. Now more than ever, it is vital to do your own research. In the end, I believe DryShips, Nordic American Tanker (NAT), and Dianna Shipping (DSX) will be a winners.


Under the radar picks for 2014.


Quicksilver Resources Inc. (KWK) is a company I think is about ready to break out. Though not a technology company, I believe it's trading substantially below its intrinsic value. Quicksilver is an independent oil and gas company, engaging in the acquisition, exploration, development, production and sale of natural gas, natural gas liquids and oil in North America. I want to show you a chart of this company, it is important for the individual investor to see what can happen with any company when they fall out of favor with Wall Street. This is a monthly chart covering 10 years.


(click to enlarge)


I like this for a triple in the coming year. I know that sounds bold, but I believe it is conservative. This is a company that has been in business over 45 years, 15 of them as a publicly traded company. The company is funded through 2016, and paying down debt.


The Horn River Basin alone holds a potential 14Tcf of natural gas, according to a third party source. The company is in final negotiations with a partner to share the cost of extraction. They have multiple operations in various parts of the US and Canada. The Fort Worth Basin holds proved reserves of 1.25 Tcfe. You can read my recent report on Quicksilver Resources Inc. here. I will be writing future articles about this exciting company, which is one of my picks to explode in 2014.


As always, I urge you to do your own research, make sound unemotional decisions and always have an exit strategy in place.


Source: After Hours Surprise From DryShips


Disclosure: I am long DRYS, NAT, KWK. I wrote this article myself, and it expresses my own opinions. I am not receiving compensation for it (other than from Seeking Alpha). I have no business relationship with any company whose stock is mentioned in this article. (More...)


This entry passed through the Full-Text RSS service — if this is your content and you're reading it on someone else's site, please read the FAQ at fivefilters.org/content-only/faq.php#publishers.


Ubisoft: The Video Game Company I'm Adding To My Portfolio In 2014

Last year, video game maker Take Two made my top ten stock picks for 2013. The stock was a top performer and one of the best video game related stocks in the market for 2013. While no video game stocks are going to make my top ten stock picks for 2014, there is one company I will be buying in 2014 for a short term and long term approach. Ubisoft (OTCPK:UBSFY), which trades in Paris and on the OTC in America offers investors upside with an exciting 2014 lineup and a newly created movie and television studio.


The 2014 lineup of games is centered around Watch Dogs and Assassin's Creed. Here is a look at current upcoming 2014 games:


· South Park: The Stick of Truth (March)


· Rayman Legends (February)


· Assassin's Creed Liberation (N/A)


· Might & Magic X: Legacy (Holiday)


· The Crew (N/A)


· Watch Dogs (N/A)


Several of these titles appear on VGChartz's list of top pre-ordered games (as of 12/14):


· 1. Watch Dogs (Playstation 4) 203,344


· 7. Watch Dogs (XONE) 128,108


· 9. South Park: The Stick of Truth (X360) 100,690


· 12. South Park: The Stick of Truth (Playstation 3) 87,611


· 13. Watch Dogs (X360) 83,750


· 16. Watch Dogs (Playstation 3) 76,857


· 27. Watch Dogs (PC) 38,353


· 32. The Crew (Playstation 4) 34,331


While, only Assassin's Creed Liberation is set to be released in 2014, a rumor is popping up that two separate games will be released. One will be for the older consoles (Playstation 3, XBOX 360) and one will be for the new consoles (Playstation 4, XOne). This will allow the company to focus on gamers with varying expectations and allow gameplay to have less glitches or lack of consistencies across platforms. The franchise is an extremely important one to Ubisoft. The games in the Assassin's Creed franchise have sold over 53.5 million copies worldwide. Assassin's Creed III sold over 10 million copies for the main Playstation 3 and XBOX 360 consoles.


Watch Dogs, on the other hand, is a potential franchise creator for Ubisoft that could pave the future. The game is highly anticipated and has been the star of several video game conventions. The company is projecting sales of the game in the 6 million range, which would provide a nice boost to 2014 revenue.


Another area of potential growth for Ubisoft is mobile gaming. The company has long depended on the success of hit games for consoles, but has put an emphasis on mobile and social games via several acquisitions. On October 1st, the company acquired Future Games. The profitable mobile game company is behind the hit Hungry Shark series. Hungry Shark Evolution, the fourth instalment in the franchise, has been downloaded over 20 million times. The company has recorded over 100 million total downloads. Ubisoft has seen some success with its transition to the Assassin's Creed brand to mobile. The current Assassin's Creed Pirates game is the company's latest attempt to further monetize the franchise.


The long term picture for Ubisoft centers around movies and television. The company founded Ubisoft Motion Pictures in May of 2011. The company will be responsible for monetizing the characters in the video game company's franchise through other mediums. Here is a look at current games being developed into movies:


· Assassin's Creed (2015, 20th Century Fox and New Regency)


· Splinter Cell (TBA, New Regency and Thunder Road)


· Watch Dogs (TBA, Columbia Pictures and New Regency)


· Ghost Recon (TBA, Warner Brothers and Platinum Dunes)


· Rabbids (TBA)


· Far Cry (TBA)


The two biggest products in the movie category appear to be adaptations of Assassin's Creed and Splinter Cell. Currently, Assassin's Creed has Michael Fassbender set as the star and a producer. The movie is set to be released in the fall of 2015, after previously having a Memorial Day weekend scheduled release. Splinter Cell has "The Dark Knight Rises" star Tom Hardy set to start and serve as a producer. The Ghost Recon franchise is also rumored to be turned into a Michael Bay franchise for Warner Brothers.


Along with movies, Ubisoft is also working on television and recently launched its first series with "Rabbids Invasion". The show airs on Nickelodeon and has already been renewed for a second season. Twenty eight episodes have aired since August of 2013, with another 24 set to air for the first full season. The show's second season will begin airing in the middle of 2014. Rabbids is an extension of the Rayman franchise owned by Ubisoft.


To me, the move into motion pictures is similar to what Hasbro did with turning its brands into entertainment assets. Hasbro has had success with the Transformers movie line, but also failures like Battleship. However, by partnering with movie studios to help share the costs, Hasbro has seen film and television as a nice revenue booster for the company. Obviously there have been some disastrous video game movie adaptations by other studios recently, but Ubisoft has a strong following in the United States and international markets. With stars attached to help oversee the movie adaptations, film buzz should continue to pick-up. "Prince of Persia" made less than $100 million in domestic box office revenue, but strong international revenue took the movie over $330 million in worldwide box office. In fact, only "Lara Croft: Tomb Raider" in 2001 has grossed more than $100 million in domestic markets as a video game big screen adaptation. Ubisoft will face an uphill battle, but I believe they have the right names attached to make this happen.


Shares of Ubisoft have taken a hit after changing the release dates for Watch Dogs and The Crew, including a 20% pre-market drop after the announcement. Sales in the first half of 2013-2014 were up, but the operating loss increased. The sales were powered by strong back catalog sales (+16%) and digital sales (+29%). The company saw its market share drop slightly, but it maintained its number four position for independent video game publishers in the United States. US share dropped to 5.4% (from 6.4%). In Europe, the company increased its market share to 7.2% (vs. 6.9%), but dropped down to number four, from the prior year's number three market share position.


In the first half of the 2013 fiscal year, the company saw sales slanted towards Europe (40%) and North America (50%), with the Rest of World region making up only 10%. By console, Ubisoft was split pretty even in the first half of the year, with X360 leading with 29% of sales, and Playstation 3 (24%) and Wii (24% Wii and WiiU) following close behind. PC made up 17% in the first half of the year, while the other category, which includes mobile, made up 4% of total sales.


The company is projecting a net loss for the current fiscal year, but sees strong results coming in 2014 and 2015, thanks to a nice game lineup and strong digital sales. I believe the company is not yet pricing in or guiding sales and operating income based on movies or television yet.


Investors are better suited to buy shares of Ubisoft via the Paris Stock Exchange, where the company currently has a market capitalization of over $1 billion. Average volume is 600,000 shares per day. In the United States, on the OTC, only 10,000 shares of Ubisoft trade hands on a daily basis. The company also has a market capitalization of $1.4 billion, giving investors a slight premium to buy this video game maker. Shares of Ubisoft have only traded in the United States since 2010, where they remain near flat since that time. In Paris, shares traded for three times what they do now back in parts of 2008 and 2009.


While I don't think shares of Ubisoft will triple in the next couple of years, they do offer significant upside. The company has great brands and like my Take Two pick, has the potential huge impact of one blockbuster busting out the stock. The addition of mobile games and movies adds to the upside and is not being fully factored in by investors. If there is one video game stock for investors to buy in 2014, Ubisoft is the pick.


Source: Ubisoft: The Video Game Company I'm Adding To My Portfolio In 2014


Disclosure: I have no positions in any stocks mentioned, but may initiate a long position in UBSFY over the next 72 hours. I wrote this article myself, and it expresses my own opinions. I am not receiving compensation for it (other than from Seeking Alpha). I have no business relationship with any company whose stock is mentioned in this article. (More...)


This entry passed through the Full-Text RSS service — if this is your content and you're reading it on someone else's site, please read the FAQ at fivefilters.org/content-only/faq.php#publishers.


Fifth Street Finance: More Insider Buying Bodes Well For This 11% Yielder

Fifth Street Finance (FSC) is a business development company or "BDC" that invests in a wide range of industries through both debt and equity. These investments often provide the company with high yields as well as capital appreciation which it then uses to pay shareholders a very generous monthly dividend.


Since companies in this sector typically pay out a high percentage of earnings, there can be an above-average risk of a dividend cut if earnings do not come in as high as expected. This is a downside risk to consider when investing in BDC's. These companies also announce secondary stock offerings with a (relatively) fair amount of frequency, which is another potential downside risk. However, these risks appear limited for Fifth Street Finance now because it already did a secondary offering earlier this year and because it tends to do these offerings only when the stock is trading above book value. This stock currently trades well below book value which is around $9.75 per share, indicating it is undervalued.


Furthermore, this company recently announced a $100 million share buyback and the CEO just bought shares so it seems like a secondary is off the table with the stock trading at such cheap levels. The risk of a dividend cut is also not likely at this time because the company already recently reduced it to 8.33 cents per share on a monthly basis. It also does not seem likely because the company recently stated that it expects earnings to meet or exceed the current payout.


In another article I noted that the yield now appears sustainable and that this viewpoint is shared by JP Morgan (JPM) whose analyst called the dividend "secure". The analyst gave the stock an "overweight" rating and set a $10 price target. Naturally, the dividend cut caused the stock to drop and I believe that since it happened to push the shares towards 52-week lows at the end of the year, that the decline was then further exacerbated by tax-loss selling. As I have been recently highlighting, it can be very rewarding to buy beaten-down stocks at this time of year since many are able to rebound in what is known as the "January Effect Rally". This strategy can pay off big in a short amount of time. To read more about this and hear about another cheap stock that is a top pick for a January Effect Rally, read this article. Let's take a look at the chart below for more details on where this stock has been and where it might be going:


(click to enlarge)


As the chart above shows, this stock was trading for just over $10 in November, but then the dividend cut and ensuing tax-loss selling put a significant amount of pressure on it. If this stock is trading at about $9.24 per share in the midst of tax-loss selling season, (which is not far from the 52-week low of $8.94), it makes you wonder where it might trade once that strong selling pressure is over. I believe the answer is that it could rebound to about $9.75 in January for two reasons: First of all, the 50-day moving average is nearly $9.75 (the 200-day average is slightly higher) and secondly, the book value is $9.75 per share. The 50 and 200-day moving averages are typically key support levels and in a rebound, those levels might act like "magnets" taking the share price upward, especially since the book value also supports this level. The decline caused by the dividend cut and tax-loss selling seems excessive, especially when you consider that the shares yield about 11%.


The cheap valuation on this stock seems to be what caused the company to recently announce a $100 million share buy back and it also appears to have sparked some bargain-hunting on the part of the CEO. On December 13, Leonard Tannenbaum bought 20,000 shares in a transaction valued at roughly $180,000. This is a significant buy in itself, but what's also impressive is that it follows up on a number of other insider buys made throughout 2013.


In summary, the combination of a cheap (below book) valuation, tax-loss selling pressure (which will soon reverse and potentially lead to a January Effect Rally), a still generous yield of nearly 11%, and repeated insider buying, all seem to indicate that this stock is worth buying now. Furthermore, the company will be paying its next monthly dividend of 8.33 cents per share to shareholders of record as of January 15th, so investors won't have long to wait to get paid.


Here are some key points for Fifth Street Finance

Current share price: $9.24

The 52 week range is $8.94 to $11.13

Earnings estimates for 2014 (fiscal year): $1.03 per share

Earnings estimates for 2015 (fiscal year): $1.07 per share

Monthly dividend: 8.33 cents per share, which yields about 11%


Data is sourced from Yahoo Finance. No guarantees or representations

are made. Hawkinvest is not a registered investment advisor and does

not provide specific investment advice. The information is for

informational purposes only. You should always consult a financial

advisor.


Source: Fifth Street Finance: More Insider Buying Bodes Well For This 11% Yielder


Disclosure: I am long FSC. I wrote this article myself, and it expresses my own opinions. I am not receiving compensation for it (other than from Seeking Alpha). I have no business relationship with any company whose stock is mentioned in this article. (More...)


This entry passed through the Full-Text RSS service — if this is your content and you're reading it on someone else's site, please read the FAQ at fivefilters.org/content-only/faq.php#publishers.


Final 2013 Country Stock Market Performance Numbers


With the 2013 trading year now closed for business, below is a look at the final stock market performance numbers for 76 countries around the world (% chg in local currencies).


As shown, Dubai finished up the most in 2013 with a gain of 107.69%. Japan was up the fourth most with a gain of 56.72%, making it the best performing G7 country. The US ended up in 9th place globally with a gain of 29.6% -- not bad!


Of the other G7 countries, Germany finished third with a YTD gain of 25.48%, followed by France (17.99%), Italy (16.56%), the UK (14.43%) and Canada (9.55%).


Only 16 of the 76 countries shown finished in the red in 2013. Peru was down the most with a decline of 23%, while Brazil was the second worst performer on the list at -15.50%. It ended up being a rough year for the BRICs (Brazil, Russia, India and China). Of the four BRIC countries, three finished down (Brazil, Russia, China) while India was up just 8.98%. Will 2014 be the year where the BRICs make a comeback? We'll get our first data point on Thursday. Happy New Year!


Source: Final 2013 Country Stock Market Performance Numbers


Which Seeking Alpha App is best for you?


Seeking Alpha Portfolio


Tech Investor


ETF investor


Energy Investor


Email me a link to open from my phone:


PORTFOLIO


SymbolAlertsPriceChg% Chg


This entry passed through the Full-Text RSS service — if this is your content and you're reading it on someone else's site, please read the FAQ at fivefilters.org/content-only/faq.php#publishers.


Dividend Portfolio Playoffs Wild Card Game: JPMorgan Vs. Dunkin' Brands

In the first round of the Dividend Portfolio playoffs we have #9 seeded JPMorgan Chase & Co. (JPM) taking on #8 seeded Dunkin Brands Group Inc. (DNKN). JP Morgan is a financial holding company and is engaged in investment banking, financial services for consumers and small business, commercial banking, financial transaction processing, asset management and private equity. Dunkin' Brands Group is a franchiser of quick service restaurants serving hot and cold coffee and baked goods, as well as hard serve ice cream in the form of Dunkin' Donuts and Baskin-Robbins, respectively.


The following table depicts the recent earnings reports for each company:


Ticker


Earnings


Date


Actual EPS


($/share)


Estimated EPS


($/share)


Actual Revenue


($ in billions)


Estimated Revenue


($ in billions)


JPM


11Oct13


1.42


1.29


23.90


24.14


DNKN


24Oct13


0.41


0.43


0.186


0.182


JPMorgan is up 34.02% excluding dividends in the past year (up 36.76% including dividends) while Dunkin' is up 48.93% excluding dividends (up 50.34% including dividends), and are beating the S&P 500, which has gained 31.28% in the same time frame. This matchup will be played out in a best of seven game series based on the metrics below. For a complete list of all the metrics utilized in the seven game series click here (http://seekingalpha.com/article/1920771-dividend-portfolio-super-bowl). Not all the metrics will be looked at if a team can win and win early. This wild-card matchup will determine the winner which will go on to play against L-3 Communications Holdings, Inc. (LLL) in the next round of the playoffs for the Dividend Growth Portfolio Super Bowl.


Forward P/E


Forward P/E is the metric of how many times future earnings you are paying up for a particular stock. The earnings portion of the ratio I utilize is the earnings value for the next twelve months or for the next full fiscal year. I like utilizing the forward P/E ratio as opposed to the trailing twelve month P/E ratio because it is an indication of where the stock is going to go in the future. I like to get a glimpse of the future, but will take note of where it was coming from in the past. JPMorgan carries a 1-year forward-looking P/E ratio of 9.65 which is inexpensively priced for the future in terms of the right here, right now while Dunkin's 1-year forward-looking P/E ratio of 26.81 is currently fairly priced. Game 1 goes to JPMorgan.


1-yr PEG


This metric is the trailing twelve month P/E ratio divided by the anticipated growth rate for a specific amount of time. This ratio is used to determine how much an individual is paying with respect to the growth prospects of the company. Traditionally the PEG ratio used by analysts is the five year estimated growth rate, however I like to use the one year growth rate. This is because as a capital projects manager that performs strategy planning for the research and development division of a large-cap biotech company I noticed that 100% of people cannot forecast their needs beyond one year. Even within that one year things can change dramatically. I put much more faith in a one year forecast as opposed to a five year forecast. The PEG ratio some say provides a better picture of the value of a company when compared to the P/E ratio alone. The 1-year PEG ratio for JPMorgan is currently at 0.36 based on a 1-yr earnings growth of 35.96% while Dunkin's 1-yr PEG ratio stands at 1.98 with a 1-yr growth rate of 18.85%. JPMorgan takes a 2-0 lead on Dunkin'.


EPS Growth Next Year


This metric is really simple, it is essentially taking the difference of next year's projected earnings and comparing it against the current year's earnings. The higher the value the better prospects the company has. I generally like to see earnings growth rates of greater than 11%. Again, in this situation I like to take a look at the one year earnings growth projection opposed to the five year projection based on what I discussed in the PEG section above. JPMorgan has great near-term future earnings growth potential with a projected EPS growth rate of 35.96% while Dunkin sports a growth rate of 18.85%. JPMorgan seems to be running away in this battle by taking a 3-0 lead in this best of seven series.


Dividend Yield


Dividend yield is a no brainer; it must be had in a dividend portfolio. The dividend yield is the amount of annual dividend paid out by a company in any given year divided by the current share price of the stock. In my dividend portfolio I don't discriminate against low yielding stocks as long as they provide excellent fundamental metrics in the form of the forward P/E, the 1-yr PEG and the 1-yr EPS growth rate. Dividends are a way to measure how much cash flow you're getting for each dollar invested in the stock. Obviously, the higher the yield, the better, as long as it is covered by the trailing twelve month earnings. JPMorgan pays a dividend of 2.62% with a payout ratio of 34% of trailing 12-month earnings while Dunkin pays a dividend of 1.58% with a payout ratio of 59% of trailing 12-month earnings. JPMorgan takes the series in a clear sweep of the seven game series.


Conclusion


Although JPMorgan upsets #8 seeded Dunkin', Dunkin is still a great company with excellent growth prospects. Because I am a value dividend investor the first three matches carried the most importance because they were fundamental metrics and JPMorgan appeared to be the better valuation stock. In my opinion the banks still have not participated in this rally and I believe 2014 will be a strong year especially for JPMorgan. After dismantling Dunkin', JPMorgan will advance to the next round of playoffs and go head to head against the #1 seeded L-3 Communications.


(click to enlarge)


Disclaimer: This article is meant to serve as a journal for myself as to the rationale of why I bought/sold this stock when I look back on it in the future. These are only my personal opinions and you should do your own homework. Only you are responsible for what you trade and happy investing!


Source: Dividend Portfolio Playoffs Wild Card Game: JPMorgan Vs. Dunkin' Brands


Disclosure: I am long JPM, DNKN, LLL. I wrote this article myself, and it expresses my own opinions. I am not receiving compensation for it (other than from Seeking Alpha). I have no business relationship with any company whose stock is mentioned in this article. (More...)


This entry passed through the Full-Text RSS service — if this is your content and you're reading it on someone else's site, please read the FAQ at fivefilters.org/content-only/faq.php#publishers.


Rhino Resource Partners: New Leadership, New Strategy?

The coal industry has been hit extremely hard the last few years. The strategy in which Rhino Resource Partners (RNO) decides to counter this new market will determine their resilience and ultimately their position within the sector in the next couple years. With new management, will Rhino continue to diversify into other non-mining assets such as Natural Resource Partners (NRP), or will they concentrate on their core business of coal and take the chance of higher market prices in the near term?


Overview


Rhino Resource Partners is a master limited partnership that is focused on coal, oil and gas, and related infrastructure within multiple basins in the United States. They produce steam coal that is used to produce electricity and metallurgical coal used in the steel-making process. At the time of writing this article, the share price stood at $10.16.


Management


As of October of this year there was a change of leadership within Rhino . David Zatezalo was the CEO since May 2004 and is now chairman of the board of directors, as per his retirement. He has been replaced by the long standing Senior Vice President and COO Christopher Walton. Walton has over 20 years of experience within the mining industry with roots in Sands Hill Mining Group and holds a degree in mining engineering and an MBA. The remaining leadership and bios can be seen here.


The leadership of Rhino is very interesting in that not only do they have specific and extensive experience within various positions within the coal industry, they have very little experience in other sectors. In actuality, the only member of the management that does have other experience is the corporate secretary Ms. Kegley who practiced law prior to joining Rhino in 2012. I find this interesting in that the coal industry could benefit from new ideas outside the sector given the beating it has taken the last couple of years. Granted, this has been primarily due to market prices, though I would have actually liked to of seen "fresh blood" within this sector.


This is especially important within the coal industry that has such emphasis on leadership having a mining background. Coal mining needs a new strategy in order to take advantage of the bottoming out of prices, if it is now or when it occurs. Promoting from within does has its advantages though when it comes to the CEO position, I do not believe that this always applies. Without a new aggressive plan to take advantage of a rising coal market I am concerned that Rhino will not be able to take full advantage. In essence, will old tricks work in a new coal market?


Number Comparison


Rhino continues to hurt due to low coal prices on par with the others within the sector.


September 2013December 2012
Total Assets (Last 3 Months)$ 552,147,000$ 559,458,000
Income (Last 3 Months)$ 2,841,000$ 8,803,000
Net Cash (Last 9 Months)$ 1,077,000$ 540,000
Net Cash Reinvested (Last 9 Months)$ 22,797,000$ 50,777,000
Net Cash Increase (Last 9 Months)$ 616,000$ 91,000

(More on hand cash due to less reinvested.)


RNO Book Value (Per Share) Chart


Diversity


Rhino has geographically diverse asset base with coal reserves located in Central Appalachia, Northern Appalachia, the Illinois Basin and the Western Bituminous region.


Non-Mining Assets


Oil and Gas: Rhino has invested into oil and gas mineral rights that have/continue to generate revenues via infrastructures support services primarily in the Utica Shale region as the "Projects" section below describes.


Cana Woodford


During 2011, they completed the acquisition of oil and gas mineral rights in the Cana Woodford region of western Oklahoma for a total purchase price of approximately $8.1 million, which consists of approximately 1,900 net mineral acres. Royalties from mineral rights started early 2012.


Razorback


In the second quarter of 2012, service company "Razorback" created to provide drill pad construction services in the Utica Shale for drilling operators. Razorback completed the construction of three drill pads during 2012.


Muskie Proppants


In December 2012, initial investments of approximately $2.0 million in a new joint venture, Muskie Proppants LLC Wexford Capital affiliates. Muskie was formed to provide sand for fracking operations to drillers in the Utica Shale region and other oil and gas basins in the U.S.


Timber Wolf Terminals


In March 2012, initial investment of approximately $0.1 million in a new joint venture, Timber Wolf Terminals LLC with Wexford Capital affiliates. Timber Wolf was formed to construct and operate a condensate river terminal provides barge trans-loading services for parties conducting activities in the Utica Shale region. The initial investment was Rhino's proportionate minority ownership share to purchase land for the construction site of the condensate river terminal.


Limestone


The Sands Hill mining complex's purpose is to sell to various construction companies and road builders that are located in close proximity to the mining complex when market conditions are favorable.


Advantages


In addition to coal mining, Rhino has a linear production model with subsidiaries in support of their mining operations via transportation (Rhino Trucking), mine related construction, site and roadway maintenance, and post-mining reclamation (Rhino Services), and in house drilling and blasting activities. A somewhat stable customer base of electric companies provides some stability as long as production costs are kept low. Coal purchases come primarily from U.S. utilities to generate electricity and the production of steel. A stable customer base of electric companies is a plus though the hardship of steel companies like American steel companies AK Steel Holding Corp. (AKS) and United States Steel Corporation (X) provides even more difficulty for Rhino though it provides cheaper materials for American steel companies. For the year-ended Dec. 31, 2012, data from the U.S. Energy Information Administration (EIA) showed that the United States relied on coal for approximately 37% of its power generation, compared to approximately 30% for natural gas.


RNO Return on Equity (<a href='http://seekingalpha.com/symbol/ttm' title='Tata Motors Limited'>TTM</a>) Chart


Negatives


Unlike Natural Resource Partners, Rhino has not made a concerted effort to branch out into other natural resources to supplement the coal production. Revenue from non-mining activities continue to grow though will it be enough? They seem to have concentrated on their in-house linear production model vice diversity. I believe this is the greatest mistake that they have made given the uncertainty of coal pricing. However, the advantage to this is any prolonged coal bottoming will give Rhino an advantage, as they should be able to provide coal to the market for the cheapest prices. If they do not achieve low industry production costs they will have an increased chance of falling behind rivals like Natural Resource Partners. Slumping steel prices also play havoc on the bottom line as this is another primary source of income for Rhino.


RNO EBITDA Per Share (<a href='http://seekingalpha.com/symbol/ttm' title='Tata Motors Limited'>TTM</a>) Chart


Safety and Environmental


Non-fatal days lost time incidence rate for all operations for the year ended Dec. 31, 2012, was 1.27 as compared to the national average of 2.40, as reported by MSHA, or 47.1% below national average. 2012 average MSHA violations per inspection day was 0.51 as compared to the national average of 0.87 violations as reported by MSHA, or 41.4% below national average. In 2012 Rhino received seven "Sentinels of Safety" awards from the Department of Labor.


Conclusion


I believe that coal prices will increase though I believe they will not hit historic levels. Natural gas will continue to take market share as time passes and coal will eventually be primarily an export for Rhino. Companies such as Kinder Morgan (KMI, KMP, KMR) will have the advantage of long-term stability. I think Rhino needs to increase their international footprint in order to be a long term holding. Rhino Resource Partners is a potential short position (bought below $11.09) once coal prices begin to recover, though I do not believe this is a potential long-term holding until they continue to diversify outside of the coal sector or they increase their international exposure.


Source: Rhino Resource Partners: New Leadership, New Strategy?


Disclosure: I have no positions in any stocks mentioned, and no plans to initiate any positions within the next 72 hours. I wrote this article myself, and it expresses my own opinions. I am not receiving compensation for it (other than from Seeking Alpha). I have no business relationship with any company whose stock is mentioned in this article. (More...)


This entry passed through the Full-Text RSS service — if this is your content and you're reading it on someone else's site, please read the FAQ at fivefilters.org/content-only/faq.php#publishers.


Is Starbucks' Dividend Still A Rocket Ship?

One of the potentially lucrative ways to participate in a dividend growth strategy is to buy a company with a "maturing dividend" (that is, the dividend growth rate is greatly exceeding the earnings growth rate by design, as management decides to give more and more money to shareholders) and enjoy high dividend payouts five to ten years from now in relation to the actual amount of cash that you deploy.


One such company that grants investors the opportunity to participate in that phenomenon is Starbucks (SBUX), which did not begin paying out a dividend until 2010 and now has a three-year record on the books of making substantial dividend increases.


In 2010, Starbucks paid out $0.36 in dividends. Then, it paid out $0.56 in 2011, $0.72 in 2012 and over the course of 2013, Starbucks has decided to put $0.89 in the pockets of shareholders. The current dividend of $0.26 per share projects an annual payout of $1.04 per share.


This is why it is lucrative to get in the habit of looking out a few years to where a dividend might be. In 2010, Starbucks traded at an average price of $27.25 per share. When you collected $0.36 in 2010 (the dividend was not initiated until the second quarter), you might have found it unimpressive to be collecting 1.32% in immediate cash profits on your investment. But then fun accelerated with time: as we sit here at the end of 2013, just three years later, that initial investment is now generating 3.81% on the amount of money you invested, rather than the tiny 1.32% you saw at the outset.


The capital gains have been quite nice, too: that $27.25 average price in 2010 has grown to over $78 now, for a capital gain of 186% in just under three years. A small initial yield can often mask the growth in dividends and capital appreciation that lay ahead five to ten years down the road for the investor who has time to be patient before starting to draw on the dividend income.


Even though a lot of dividend growth at Starbucks has already happened over the past three years, that does not mean that the rocket ship effect in which dividend growth outpaces earnings growth has come to an end. Even with a $1.04 annual dividend payout, Starbucks still possesses an earnings power base of $2.26 per share, for a payout ratio of 46%.


The interesting thing about Starbucks is that the earnings per share growth has a tendency to perform better than you'd initially expect. For instance, when a recession strikes, one of the most common advice tropes is that you should give up your daily morning coffee. Whether that is good wisdom or not, Starbucks still managed to grow profits during the financial crisis from $0.71 per share in 2008 to $0.80 per share in 2009, for a 12.67% percentage increase. That 12%-13% earnings growth in the pit of the recession proved to be more resilient than many of the blue-chip companies that I happen to personally admire.


And when good economic times hit, Starbucks' growth tends to really take off. Right now, Starbucks is growing profits per share at its existing stores by slightly under 8%. Not only is this retail portion of the company growing, but Starbucks seems to finally be making significant investments in its consumer packaged goods department, which only represents 12% of the company right now. When you look at the joint ventures with Pepsi and Dreyer's to develop bottled drinks and ice cream brands sold at supermarkets, as well as Starbucks asserting ownership of its distribution network by ending a partnership with Kraft, it is almost as if Starbucks has this little secret weapon in its arsenal growing at 15-20% per year. It doesn't get as much attention as the same-store traffic increases in the United States, or the prospects of saturating the Chinese market with Starbucks outlets, but it is sitting right there in the numbers: a consumer packaged goods division that is growing quite healthily and contributing double-digit growth to the Starbucks bottom line.


I think Starbucks ought to deserve a spot on the short list of companies that might grow its dividend by 10% or more on average over the next five to ten years. You have coffee prices remaining low, you have rapid growth in China, you have 7% same-store sale increases in the United States, you have a consumer packaged division that only accounts for 12% of business but is hitting its stride, and you have a payout ratio drifting from the 40% range towards the 60% range (long-term) as the demands on the company's cash flow remain under control. And the best thing of all is that the company's profits have proven recession resistant as the company experienced 12.67% growth from 2008 to 2009. If you are searching for companies with high dividend growth rates, Starbucks might deserve a spot on your shopping list when you can get it at the right price.


Source: Is Starbucks' Dividend Still A Rocket Ship?


Disclosure: I have no positions in any stocks mentioned, and no plans to initiate any positions within the next 72 hours. I wrote this article myself, and it expresses my own opinions. I am not receiving compensation for it (other than from Seeking Alpha). I have no business relationship with any company whose stock is mentioned in this article. (More...)


This entry passed through the Full-Text RSS service — if this is your content and you're reading it on someone else's site, please read the FAQ at fivefilters.org/content-only/faq.php#publishers.


Crocs: Missing The Big Picture

It was a big day recently for footwear retailer Crocs (CROX). The company announced a financial partnership with Blackstone that will involve $200 million of preferred shares. According to the press release, this cash infusion will allow Crocs to buy back a significant amount of stock going forward, which normally looks good for any company. However, Crocs made a number of other announcements that may have been missed, which don't tell the whole story with this struggling retailer. Today, I'll detail why the latest deal for Crocs may seem good at first glance, but not when you drill it down. The devil is truly in the details.


Specifics of the deal:


An investment fund affiliated with Blackstone will purchase $200 million in newly issued series A preferred stock. Additional details below are taken right from the press release:


The Preferred Stock will have a 6.0% cash dividend rate and is convertible into shares of common stock at a conversion price of $14.50 per share. This conversion price represents a 9% premium to the closing price of $13.33 per share on December 27, 2013, and a 10% premium to the 30-day average closing price of $13.19 per share. On an as-converted basis, the Preferred Stock will represent 13.8 million common shares, or approximately 13% of the fully-diluted common shares outstanding after giving effect to the issuance.


At any time after three years from the issuance date, if the closing price of Crocs common stock equals or exceeds $29.00 (i.e., 200% of the conversion price) for a period of 20 consecutive trading days, then the shares of Preferred Stock will, upon notice from Crocs, convert into shares of common stock. At any time after eight years from the issuance date, Crocs will have the right to redeem, and the holders of the Preferred Stock will have the right to require Crocs to repurchase, all or any portion of the Preferred Stock at 100% of the stated value plus any accrued but unpaid dividends.


Investors cheered this deal tremendously, sending Crocs shares higher by $2.81 on Monday, or 21.08% to $16.14. This put Crocs shares at their highest point since July, and up about 35% from the 52-week low reached roughly two months ago. The number of shares traded on Monday was the most for any single day in more than two years.


Helping the share count?


Management came right out in the press release and said that it has revised its capital structure to accommodate a $350 million stock repurchase plan. This plan will include the net proceeds of approximately $180 million from the deal. Management believes that this repurchase plan will help to reduce the company's float by 30% (based on Friday's close I believe). Now, Crocs did have a repurchase plan in place. At the end of the third quarter, a little under 18 million shares were to be repurchased on the plan, as per page 15 of the 10-Q. Crocs has now switched to a dollar amount of shares instead of a share amount. Crocs also said in the press release that it has been unable to repurchase shares while negotiating this deal. The company expects to be able to repurchase shares in the first quarter of 2014.


This deal will certainly help the share count in the short term. However, since this is a deal for convertible shares, investors must realize that the conversion of those preferred shares could reverse some of the progress from the buyback. There are a few important points to remember here. First, most companies pay executives with stock options (part of their compensation or sometimes all of it). These options dilute shareholders, but they are offset by the buyback. So if a company is buying back X amount of shares over a few years, it may not get the share count down by X, due to the dilution from the options. Secondly, Crocs' buyback depends on share price. At Friday's close, $350 million in shares was equal to 26.16 million shares. That's where the company got the 30% number for the float, which Yahoo! Finance has at about 87 million shares. However, at Monday's close, thanks to the rally in the stock, $350 million would just get the company 21.69 million shares. Should shares get up to $20 a share, Crocs would be down to 17.5 million shares. Conversely, if Crocs shares were to fall to $10, the company could buy back 35 million shares. The power of this buyback will be determined by the average share price, which is anyone's guess right now. Monday's rally did not help in that respect, so new investors looking at Crocs now must keep that in mind.


The company stated that the conversion price for the preferred shares was $14.50, which means 13.8 million shares of common equity if converted. It will be a couple of years before those shares could be converted, but depending on the buyback and share price, a conversion of these shares could cancel out some or most of the buyback!


The biggest problem of all!


A couple of months ago, I last reported on Crocs when discussing the potential for the company to be bought out. While I stated the buyout potential gave enormous upside to shares, I argued at that time that a deal did not make sense. This cash infusion via preferred shares would seem to back up the notion that a buyout is not coming. One of the reasons I said that Crocs was not a great buyout candidate is that the company was struggling with revenue growth. A look at Crocs' recent earnings history shows a couple of revenue misses and some terrible quarterly revenue guidance. Crocs was expected to have a pretty strong 2013 earlier this year. There was a lot of hope, and I even discussed the potential in shares if Crocs did well. Back in June, analysts were looking for more than 11% revenue growth this year and earnings per share of $1.42.


Well, after the last couple of poor quarters, analysts do not see as bright a future for this company. Current estimates call for 2013 revenue growth of just 5.6%, basically half of what analysts were looking for about six months ago. The average earnings per share estimate is $0.82, compared to a $1.40 in the year ago period. These are non-GAAP earnings numbers, which take out certain one-time expenses, like the company's new ERP system.


So why do I make such a big deal about revenues and poor results? Well, the company provided this gem of a statement in the press release for the preferred shares:


"As we look forward, 2014 will be a significant transition period for the company. We will recruit a new CEO who will work with the reconstituted board to refine our short-term and long-term strategic plans, which will include a sharper focus on earnings growth with less emphasis on top-line growth."


So basically, the company is not going to focus on revenue growth, and it is a retailer! A company in a sales industry that's not going after sales does not make sense. The biggest problem for this company is revenue growth. Remember a few years ago when this company almost went out of business? The company had a fad product, open holed shoes. Crocs has diversified its product lines since then, but as I showed above, revenue growth is struggling. Sure, the buyback will reduce the share count and that will help earnings per share. However, the buyback will have no impact on revenues, no impact on net income, and that is something to realize. Additionally, the company will be paying $12 million a year in cash dividends on those preferred shares. I'll compare Crocs against some other names later in this article.


4th Quarter guidance:


This part may have been lost in the long press release for the deal, but Crocs did update its fourth quarter guidance:


Crocs also updated its fourth quarter 2013 outlook and currently expects revenue to be at the low end of the previously provided guidance range of $220 million and $225 million, and diluted loss per share to be at the low end (meaning the higher loss) of the previously provided guidance range of ($0.20) and ($0.23). Excluded from this outlook are all costs and expenses associated with the Blackstone transaction, the tax expense associated with the repatriation of excess foreign cash, charges associated with separation agreements, retail store impairments, other asset impairments and legal reserves. We expect these aggregate charges in the fourth quarter to be in a range of $47 million to $52 million, which is an additional loss per diluted share of $0.45 to $0.50. The cash portion of the aggregate charges in the fourth quarter is estimated to be in a range of $20 million to $25 million. While not currently estimable, we expect additional restructuring charges may be necessary in 2014 as we refine our strategic plan.


So revenues are going to disappoint again. Analysts were already expecting a 1.2% decline in Q4 revenues to $222.25 million. It looks like Crocs will come in around that or perhaps even a bit lower. Analysts were looking for a $0.20 loss, so Crocs will also come in at that or a bit lower. Crocs did not provide Q1 guidance at this report, so we'll have to wait until the official Q4 earnings report, unless Crocs announces guidance before then. However, with analysts expecting a higher revenue growth rate (6.2% in 2014 above 5.6% in 2013), I expect estimates will be coming down, and Crocs could easily warn again. Remember, this company is NOT going to primarily focus on revenue growth in 2014. Additionally, weak sales through the back half of 2013 will leave the company with excess inventory. That will probably force the company to sell some items at a discount, which will pressure margins and earnings into 2014.


But there is one more part of that guidance I want to focus on. Crocs will take a cash charge in the range of $20 million to $25 million, and the company will be repatriating cash. Normally, companies do not repatriate foreign funds because they carry a heavy tax bill. The following statement is one I included in my buyout potential article about Crocs' cash situation.


As of September 30, 2013, we held $323.6 million of our total $332.5 million in cash in international locations. This cash is primarily used for the ongoing operations of the business in the locations in which the cash is held. Of the $323.6 million, $72.3 million could potentially be restricted, as described above. If the remaining $251.3 million were to be immediately repatriated to the U.S., we would be required to pay approximately $53.4 million in taxes that were not previously provided for in our consolidated statement of operations.


Because Crocs has limited cash resources in the US, it has to bring funds back into the US, and thus pay a tax. The preferred shares deal will give Crocs a lot more financial flexibility, but that cash is going directly to buying back shares! I would have been much happier if the company had used the money to expand its product line, perhaps with an acquisition. Sure, the buyback will help the earnings per share number look good, but so what if the rest of the company looks terrible?


CEO Departure:


Perhaps another lost item in this whole deal was that Crocs announced that CEO John McCarvel was retiring as president, board member, and CEO, on or about April 30th, 2014. Mr. McCarvel has been with Crocs for the past decade and has led since 2010. The board has already begun an outside search for a new CEO.


So, wait a minute. Not only did Crocs warn for Q4, meaning revenues and earnings will disappoint again. Not only is the company going to lower its focus on top line revenue growth for 2014. Now, the company will be going through a transitional period to find a new leader. It's hard to recommend an investment when the company is not focusing on revenues, only cares about buying back stock, and will be in the midst of a large executive transition.


A comparison of names in this space:


When I last compared Crocs to others in the space, I used the following names as comps: Deckers Outdoor (DECK), Wolverine World Wide (WWW), Steven Madden (SHOO), and Skechers (SKX). The following table shows a comparison of these names for 2014 in both of growth estimates (from analysts) and valuations. These numbers are as of Monday's close for valuations and estimates. So should analysts take down their revenue numbers for Crocs (and raise EPS numbers), it will not be reflected in the table.


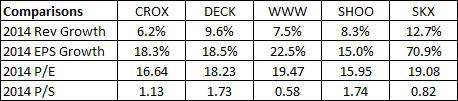
As you can see, Crocs is projected for the least amount of revenue growth in 2014. This follows a poor 2013, where Crocs is also projected to show the least amount of revenue growth. Crocs, as I mentioned above, is also expected to show a huge earnings drop in 2013, but let's put the past behind us for now. In 2014, Crocs is expected to show the 4th most earnings per share growth at present. The buyback will probably get that number to 3rd or 2nd place, but that assumes that results come in as expected.


On paper, Crocs does appear to trade at a discount to the other four names. The average P/E and P/S values for the other four companies are 18.18 and 1.22, respectively. However, Crocs is giving you the least amount of revenue growth. Additionally, Crocs is giving average earnings growth for the space, and you must consider the huge plunge in 2013 earnings. Even if Crocs' buyback were to boost earnings to 10% above current analyst estimates, the company would still be looking at a large drop from 2012 levels. Another point to consider is that Crocs rallied by 21% on Monday. If you were looking to buy the name at a huge discount, last week was your chance. A large chunk of the discount is gone now.


Final thoughts:


Crocs' deal to sell preferred shares in an effort to buy back stock seems great on paper, but the devil is in the details. These preferred shares come with a $12 million annual cost, so one must wonder if Crocs could have done better with a debt deal. Additionally, these shares could become convertible in a few years, which could reverse a small or even a significant part of the buyback.


But perhaps the worst part of this deal is that it is all about capital returns and trying to maximize share value. It is not about maximizing company value. Crocs has disappointed on the revenue front in 2013, and just warned on Q4 results. The company specifically said that it is not going to primarily focus on revenue growth during a transitional 2014 period. This transitional period will also see the departure of the current CEO and the company will need to find a new leader. The departure of a leader really hurt shares of Canadian apparel maker lululemon (LULU) recently. After showing the least amount of revenue growth in 2013 against others in the industry, Crocs is expected to show the least amount of revenue growth again in 2014. Again, the money from this deal is not going to improve the business, it is all about propping up the stock.


In the end, the deal seems like a short-term positive. The buyback will certainly help boost earnings per share and will reduce the share count and float. However, do keep in mind that the longer term implications of this deal shift to the negative side, as the company's biggest issue in my opinion is sputtering revenue growth. Crocs will have to pay 6% a year on these shares, and the only way it can stop those payments is to have the shares converted, which will reverse part or most of the buyback. In the end, Crocs is looking to appease shareholders in the short run, but I think that hurts the company in the long run. For that reason, I'm tagging this article as a "Short Idea". I'm not necessarily recommending you run out and short Crocs today, but there will be times when you can do so. I don't see how this deal helps Crocs the company in the long run, and that will make Crocs stock a decent short at some point as results are likely to disappoint.


Source: Crocs: Missing The Big Picture


Disclosure: I have no positions in any stocks mentioned, and no plans to initiate any positions within the next 72 hours. I wrote this article myself, and it expresses my own opinions. I am not receiving compensation for it (other than from Seeking Alpha). I have no business relationship with any company whose stock is mentioned in this article. (More...)


Additional disclosure: Investors are always reminded that before making any investment, you should do your own proper due diligence on any name directly or indirectly mentioned in this article. Investors should also consider seeking advice from a broker or financial adviser before making any investment decisions. Any material in this article should be considered general information, and not relied on as a formal investment recommendation.


This entry passed through the Full-Text RSS service — if this is your content and you're reading it on someone else's site, please read the FAQ at fivefilters.org/content-only/faq.php#publishers.


First Solar: The Year In Review

First Solar (FSLR), one of the world's largest solar panel manufacturers and project developers, has had a good year. The company's stock price is up by around 80% year-to-date on the back of growing global solar demand, strong execution on its utility scale-projects as well as improving efficiencies, which have helped margins. Through the year, the company also took some strides toward improving its manufacturing technology and de-risking its product portfolio through some acquisitions. Here is a brief overview of First Solar's 2013.


We have a $58 price estimate for First Solar, which is slightly above the current market price.


Improving Financial Performance and Position


First Solar's financial performance has been improving over the last few quarters aided by growing global solar demand as well as strong execution of the company's large-scale solar projects. For the first nine months of this year, the company's operating margins stood at around 12% versus an operating loss during the same period last year. First Solar also remains one of the healthiest companies in the solar industry. At the end of Q3 2013, the company's cash and cash equivalents stood at around $1.2 billion while total debt fell to around $230 million, which is relatively low when compared to most other tier-1 solar manufacturers. [1] Having a strong financial position is an asset for solar project developers like First Solar since customers signing long-term contracts typically look at the financial stability of the vendor.


Systems Business: Strong Execution, But Pace Of New Orders May Need To Pick Up


First Solar's systems business continued to be the driving force behind the company's performance this year, as construction on the Topaz, Desert Sunlight and Agua Caliente projects (which together have a capacity of close to 1.4 GW) bolstered results. (Form 10-Q) The projects business, which now accounts for around 85% of First Solar's revenues, has proved lucrative for the company since it entails supplying solar panels along with the related engineering, procurement and construction services.


While execution has been strong, we believe that the company will need to ramp up its new bookings in order to grow the systems business going forward. First Solar began the year with a total order backlog of around 2.6 gigawatts (GW), and this number has only improved marginally since then to roughly 2.7 GW as of the end of Q3 2013. While the company has indicated that it has new booking opportunities to the tune of about 7.7 GW, it will be important to convert these leads into orders.


Panels Business: Cost Improvements And Technology Acquisitions


A precipitous decline in the prices of Chinese panels over the last few years threatened First Solar's position as one of the world's lowest-cost solar panel manufacturers. However, this year, the company has taken some significant strides in reducing its panel manufacturing costs and improving conversion efficiency. As of Q3 2013, First Solar was able to reduce its core panel costs (excluding freight, recycling and warranty charges) to under $0.50 per watt, which is now the lowest in the solar industry. [2] In comparison, Yingli Green Energy (YGE), China's largest panel manufacturer, had core manufacturing costs of more than $0.53 per watt during Q3 2013.


Through this year, First Solar also took some steps to improve its technology by acquiring General Electric's (GE) thin-film solar panel technology with the related patents. GE holds a world record in lab-based efficiency for Cd-Te solar cells. Under the deal, First Solar will also supply its panels to GE, which could prove to be an attractive avenue for First Solar's panel sales since GE is the world's largest supplier of power equipment and has relationships with major power plant developers and electric utilities across the world. First Solar also made some efforts to diversify its product portfolio through its acquisition of TetraSun, a Silicon Valley based start-up that has developed a high-efficiency polycrystalline solar technology. (Related: First Solar's Acquisition Of TetraSun Highlights A More Diversified Strategy) While the acquisitions look promising, the company has yet to begin commercial scale production using these technologies and this will remain a critical factor to watch going into 2014.


Disclosure : No positions.


Source: First Solar: The Year In Review

This entry passed through the Full-Text RSS service — if this is your content and you're reading it on someone else's site, please read the FAQ at fivefilters.org/content-only/faq.php#publishers.


J.C. Penney: Valuation Perspectives On A Battleground Stock

J.C. Penney Company (JCP) is a battleground stock. Bill Ackman went long JCP's stock for approximately $1,000,000,000, at an average cost for his 39 million shares of $25.90, then less than three years later he sold at $12.90 for a huge realized loss and claimed in Pershing Square's Q3 2013 investor letter that he was "bearish" on the company's prospects. Similarly, Kyle Bass of Hayman Capital Management went long a large chunk of JCP in mid-2013, only to turn around and sell his entire stake a few months later. Quite a few other hedge funds have dipped their toes in the JCP pool. Even the CEO of JCP has publicly placed his bet on the company. This raises the following questions: How can so many smart investors -- some long and some short (and some both) -- be completely flummoxed by JCP? And what is the company actually worth?


With respect to the first question -- "How can so many be so confused by JCP?" -- I believe that several factors have played a role. First, there was Ron Johnson and the "Apple mystique." Simply put, Ron Johnson was the supposed "genius" behind Apple's (AAPL) retail stores, handpicked by the icon Steve Jobs; Apple's retail plans succeeded beyond anyone's wildest dreams; thus, Ron Johnson became in the public's eyes a visionary who could revitalize JCP where others had failed. Bill Ackman bought this theory hook, line and sinker. Many others bought into the myth as well, such as Vornado. Unfortunately, Johnson proved to be as far from a genius as one could imagine in running JCP -- and he promptly ran it straight into the ground. With Johnson's plans to re-imagine JCP in tatters and Ullman back in the fold as CEO in place of the disgraced and deposed Johnson, other supposed geniuses -- such as Bass -- tried to pick a bottom in the stock. One can imagine how smart these masters of the universe must have thought they were in getting Mr. Ackman's shares, originally bought in the mid-$20s, on the cheap for under $13 - only to be subsequently burned by JCP's share offering. Understandably, those who bought prior to the share issuance promptly jettisoned their shares after being heavily diluted.


Second, retail is a brutally tough market sector, success or failure being subject to whatever tomorrow's fashion trend happens to be; today's heavyweight is tomorrow's weakling (and vice versa). For example, witness the recent decline of logoed teen brands and the volcanic rise of Michael Kors. One might as well read tea leaves (as opposed to SEC filings) in trying to guess what the next retail trend will be. Moreover, the rise of Internet retailing has further clouded the picture. Amazon sells everything under the sun -- and often it's a lot easier to order goods from the comfort of home rather than schlepping out to the nearest mall. Thus, it is no wonder that even the best investors have trouble figuring out how much any given retailer is worth.


This brings us to the second question: What is JCP actually worth? If so many highly intelligent investors can be fooled by JCP, is there any way to value the company with a reasonable degree of certainty? I believe that we can pursue several different paths in order to reach an answer as to whether JCP, at slightly over $9 per share (as of Dec. 31, 2013), is currently undervalued, fairly valued or overvalued. Specifically, we can look to the following metrics for JCP and see how these measure up to the same metrics for JCP's competitors: Estimated price-to-sales ratios and price-to-earnings ratios for the upcoming 2014 fiscal year based on current analysts' estimates, as well as the current price-to-book ratios and enterprise value-to-EBITDA ratios using most recently available financial statements.


For comparable companies to JCP, I have selected Macy's (M), Kohl's (KSS) and Dillard's (DDS). As a further estimate of valuation for JCP, we can make an educated guess as to the present value of JCP's future net cash flows by constructing a base, bear and bull case scenario for the company. (Please note that the following data were sourced from Yahoo Finance.)


Price-to-Sales (P/S) Ratio for FY 2014 (Estimated):


JCP = 2.77B / 12.91B = 21.4%


M = 19.61B / 28.78B = 68.1%


KSS = 12.13B / 19.38B = 62.5%


DDS = 4.23B / 6.82B = 62.0%


Conclusion: Based on this metric, JCP is extremely undervalued. If JCP had a P/S ratio equal to the average of its peers (64.2%), JCP's stock price would be approximately $27 per share, or ~3 times the current price.


Price-to-Book (P/B) Ratio (Current Through Q3 2013):


JCP = 2.77B / 2.64B = 1.05X


M = 19.61B / 5.44B = 3.60X


KSS = 12.13B / 5.92B = 2.05X


DDS = 4.23B / 1.87B = 2.26X


Conclusion: Based on this metric, JCP is severely undervalued. If JCP had a P/B ratio equal to the average of its peers (2.64X), JCP's stock price would be approximately $22.85 per share, or ~2.5 times the current price.


Price-to-Earnings (P/E) Ratio for FY 2014 (Estimated):


JCP = Not meaningful (negative earnings expected for FY 2014)


M = $53.3 / $4.32 = 12.3X


KSS = $56.7 / $4.54 = 12.5X


DDS = $96.2 / $8.02 = 12.0X


Conclusion: Based on this metric, we can conclude that if JCP were to regain profitability in the future, it should trade at a multiple of approximately 12X earnings, or perhaps somewhat less given its relatively high debt levels. Since JCP is currently losing money -- and is expected to lose money during FY 2014 -- its current price level does not appear to be too low based on this metric.


Enterprise Value-to-EBITDA (EV/EBITDA) Ratio (LTM as of Q3 2013):


JCP = Not Meaningful (negative EBITDA for the last 12 months)


M = 6.8X


KSS = 6.0X


DDS = 6.1X


Conclusion: Based on this metric, we can conclude that, if generating positive EBITDA, JCP should trade at an EV/EBITDA multiple of approximately 6.3X. Since JCP currently has negative EBITDA, its current price level does not appear to be too low based on this metric.


Present Value of Future Net Cash Flows: If we posit that JCP's adjusted earnings for its 2014, 2015 and 2016 fiscal years will be minus $2.50, breakeven and $1, respectively (for our purposes, adjusted net income will serve as a rough proxy for net cash flows), using the "NPV" function in Excel we can calculate JCP's discounted net future cash flows (DCF) for a base case, a bull case and a bear case scenario, using the following assumptions:


Base Case


FY 2017-21: 10% EPS growth; FY 2022-33: 3% EPS growth; 10% discount rate; $3 terminal value = $12.25 per share


Bear Case


FY 2017-21: 5% EPS growth; FY 2022-33: 0% EPS growth; 10% discount rate; $1 terminal value = $7.18 per share


Bull Case


FY 2017-21: 15% EPS growth; FY 2022-33: 5% EPS growth; 10% discount rate; $5 terminal value = $18.12 per share


Conclusion: Clearly, the present value of future cash flows depends heavily on the assumptions used in the calculation. As recently as JCP's FY 2010 under Ullman (i.e., the fiscal year that concluded just prior to Ackman joining JCP's board of directors), JCP earned $513M from continuing operations on an adjusted basis (or $2.16/share) on $17.8B of revenues (see press release here). If JCP can increase its revenues 15% in each of 2015 and 2016 from a base of an expected ~$13B in 2014 and get back to around the $17B level in revenues in 2016 with normalized gross margins, at least $1 per share in net income (excluding non-recurring items) in 2016 looks feasible, after adjusting for the increased share count and higher interest expense the company is paying versus 2010 (on the other hand, note that JCP reported in its 10-Q for Q3 2013 that it had $2.5B of federal net operating loss carryforwards that do not expire until 2032 and 2033, so the company, if profitable, would not owe any federal income taxes for quite a few years). Thus, under the base case DCF estimate ($12.25), as well as the midpoint between the bear and bull cases ($12.65), JCP appears significantly undervalued.


Overall Conclusion


Based on the P/S and P/B ratios, JCP is severely undervalued vis-a-vis its peers. In addition, JCP appears to be undervalued based on a calculation of its estimated DCF (using the above assumptions). However, based on the P/E and EV/EBITDA ratios, JCP does not seem to be undervalued vis-a-vis its peers. If we assume that JCP can regain profitability on an adjusted basis within the next 2 years without any further substantial dilution, I believe that we can also assume that JCP will gradually close the P/S and P/B gaps with its peers, as well as the gap between its current stock price and its base case estimated DCF.


A price per share for JCP of around $12.50 (approximately 50% of the average of the target prices for JCP based on the P/S and P/B metrics and slightly higher than the base case estimated DCF) looks achievable in the next year or so, assuming that JCP continues to evidence progress on its turnaround efforts (note that over the past four months, JCP has seen sequentially increasing same-store sales against the same months in 2012, including a 10% SSS gain in November). A stock price of $12.50 for JCP would represent nearly a 40% increase from the current price.


Source: J.C. Penney: Valuation Perspectives On A Battleground Stock


Disclosure: I am long JCP. I wrote this article myself, and it expresses my own opinions. I am not receiving compensation for it. I have no business relationship with any company whose stock is mentioned in this article. (More...)


This entry passed through the Full-Text RSS service — if this is your content and you're reading it on someone else's site, please read the FAQ at fivefilters.org/content-only/faq.php#publishers.