Let's talk about a 21 year old French model... no not runway beauties; we're talking about the Fama-French Three Factor model. Developed in 1992 by Nobel laureate Eugene Fama and academic finance pioneer Kenneth French, this may be the most important model in all of finance, both in terms of explaining risk and in terms of explaining how many zeros will be at the end of your 401(k) when you retire, if you know what I mean.
Since the 1960s, we've been dependent on a model called CAPM (capital asset pricing model) to understand the relationship between risk and return, despite the fact that its measure of risk only explains about 70% of return. This measure, beta, makes the assumption that the entirety of every stock's return is due to its exposure to the market. Put simply, every stock's returns will equal a factor of the S&P 500's returns. Thus, if a stock's beta is 2.0, it will double the S&P 500's returns on a bull day and double its losses on a bear day. Obviously, this assumption is wrong almost every day, but the idea is that this factor is explaining most of a stock's returns.
All returns not explained by beta in the CAPM model are called alpha. This is traditionally accepted as the level of skill and value added by a portfolio's manager. Higher levels of alpha indicate a significant deviation from what the model predicts, supposedly attributable to management of a portfolio. This brings us to why the use of CAPM should be frowned upon.
There is a whole laundry list of reasons not to use CAPM, beta, and alpha but here are some highlights...
- 70% is not 100%, not even close: This is pointing out the obvious. If we can explain more than 70% of returns with other risk factors, we will always end up with a better model than CAPM.
- Beta is symmetrical, risk is not: It may be hard to see from a 1 or 3 month chart of returns, but downside risk is rarely the same as upside risk. That is to say, investors do not react with equal magnitude to a market advance of 1% as they do to a market decline of 1%.
- Beta is a derivative of itself: Have you ever been hard at work on an Excel spreadsheet and a prompt informs you that you have created a "circular reference?" This is exactly what happens with beta. Since the market index used to calculate beta (usually the S&P 500) contains stocks whose returns are supposedly dependent upon beta, these stocks' returns are somewhat dependent upon themselves. Those who answered "yes" to the Excel question will note that circular references invalidate all models involved, as it does with beta on principle.
These counterpoints do not render beta, alpha, and CAPM useless, but we can do much better. The Fama-French Three Factor model is the answer. Rather than a single factor (market performance), the model throws a size factor and a value factor into the mix, replacing much of the nebulous alpha term. With the addition of these factors, Fama and French boast that their model explains as much as 96% of returns with quantifiable measures.
SMB: Small Cap Superiority
Let's start with the more intuitive of the two factors. If you had $1 to invest in the year 1926, and the choice between a portfolio of large-caps or a portfolio of small-caps, ask yourself which you would choose. If you cashed out your investment in 2009, the small-cap portfolio would be worth around $12,971, more than 5 times as much as the large-cap portfolio. In fact, the average yearly return (arithmetic) for small-cap stocks since 1926 was 17.7% compared to the large-cap average of 11.7%. An investor in the small-cap portfolio would have swallowed immense losses at some points in the century, but these losses were more than compensated by aggressive gains at other points. The ends justify the means.
Fama and French recognized the tremendous capacity of small-caps to outpace the market, and developed a factor, simply named SMB (small minus big), to describe how risk is related to this return. The factor measures the historical difference between the arithmetic annual returns of the biggest 50% of publicly traded stocks and the smallest 50%. Between 1926 and 2002, the average was approximately 3.3%.
(click to enlarge)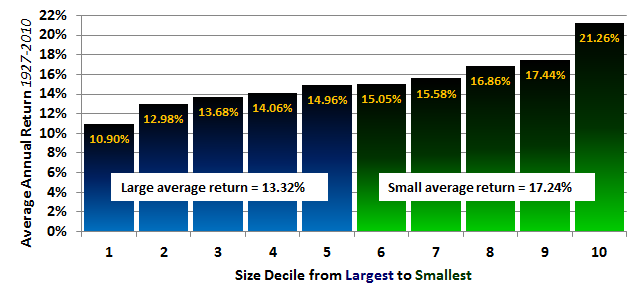
Even more astounding is that even when divided by decile, each subsequent decrease in size resulted in higher annual return without exception. The difference in returns between the largest decile and smallest decile was a whopping 10.36%.
Now, for the dark side of small-caps. It shouldn't come as a surprise that small-caps are much more volatile than large-caps. Indeed, small-caps usually swallow larger losses when the market declines, but this fundamentally shouldn't bother a long-term investor. If we are certain that losses will be more than compensated by gains, the magnitude of these losses is irrelevant. In essence, if we assume that, over the 40-60 year period for which the average investor saves for retirement, the world will not end and the human race will continue to grow, the higher volatility and tremendous temporary losses incurred by small-caps are completely irrelevant to an investor from a practical perspective. In the end, a diversified portfolio of small-caps will always outperform a diversified portfolio of large-caps by a significant amount over the average individual's investing lifetime.
Much of why small-caps tend to outperform is perception of risk rather than actual risk. The average retail investor is a little late in the game when he/she finally gets around to understanding the nuts and bolts of risk and return. Assuming you aren't 20 years old anymore, you have somewhat less than 40-60 years until retirement. With an investment horizon of 10 or 20 years, you're probably going to be quite a bit more concerned by volatility and incurring large losses. You aren't be wrong to be concerned, but you've added another dimension. As risk and volatility become a large part of your investment decision, the value you subconsciously place on a small-cap declines substantially. All other factors being equal, you are less likely to invest in small-caps and therefore, the liquidity of small-caps declines. The logical conclusion is that when a great number of investors are risk-averse, each dollar of expected future return is much less valuable from small-caps than from large-caps to today's investors.
Consider the following scenario, which illustrates the basic arbitrage strategy employed by a small cap investor. Pretend for a moment that the entire equity market consists of 5 investors and a constant amount of total funds invested (in other words, funds do not flow out of equities and into bonds or other securities in this example). Also, pretend the ages of these investors are 20, 30, 40, 50, and 60. Obviously, each investor is going to have different goals given the number of years remaining until their retirement. The 60 year old investor will probably be the most averse to risk, since he or she has less than 10 years before the need will arise to depend upon real income from retirement savings. Thus, regardless of differences in company fundamentals within the market, a psychological perception that small caps are risky investments will lead him or her to favor large caps. The 30, 40, and 50 year old investors will probably do the same, but to varying degrees.
What remains for the 20 year old investor? After the other 4 have tied up a relative majority of the total funds in large caps, the price of small caps, relative to their fundamentals, is much lower. Price movement from the first 4 investors has likely pushed prices on large caps higher and prices for small caps lower, relative to standard multiples. For example, for a large cap and a small cap which both have equal operating cash flow per share, and equal values of all other multiples, price to cash flow ratio might be 12 and 8, respectively, despite there being no difference in expected future cash flows. The key takeaway is that the present value of future cash flows is higher for large caps than for small caps because of investor perception.
Given the above psychological trend, it should make sense that as market cap increases, there is a higher concentration of highly risk averse investors. For example, the present value of future cash flows for a 10M market cap company will be lower than the present value of future cash flows for a 100M market company, all other factors being equal. Therefore, if one were to purchase shares of a 10M market cap company with $5.00 operating cash flow per share for a price of $100 per share, it would not be unreasonable to expect that, at some point in the future, the company might grow to a market cap of 100M, still have operating cash flow of only $5.00 per share, but have a share price of $120. Obviously, if the company can manage to grow cash flow per share, the price will likely increase even more, but this illustrates the idea that simply by growing in size, the price of small company stock will likely grow due to an increase in demand from risk averse investors.
Thus, there are two factors that are working in favor of small-caps.
1. Small companies naturally grow faster than large companies because of the inherent deceleration that exists in a business cycle (for a variety of reasons, it takes less for a small company to double revenue from 5 to 10 million than for a large company to double revenue from 5 to 10 billion). This is common sense.
2. Small-caps have less demand per dollar of market cap than large-caps because most of today's investors have some level of aversion to volatility and in particular, loss. Those who are not averse to volatility (long term investors) directly benefit from this difference between intrinsic value and perceived value. The simple process of market cap growth increases the average concentration of risk averse investors, creating a very predictable, consistent flow of funds.
These trends go a long way toward explaining the 3.3% difference in average historical annual returns between the smallest 50% of equities and largest 50% of equities. Stated a different way, these trends tell us why the average historical value of the SMB factor has been 3.3 and not 0.
HML: Value Over Growth
The second factor of Fama and French's Three Factor Model is known as HML (high minus low), which refers to a stock's book value compared to it's market value. Stocks with a high book to market value ratio are considered value stocks, while stocks with a low book to market value are considered growth stocks (the same measure as P/B, but stated inversely in Fama and French's work). HML is calculated by subtracting the average annual returns of the bottom 50% in terms of book to market value ratio from the top 50%. Essentially, we are left with how much better we could perform by investing in value stocks than by investing in growth stocks. Historically, the difference has been 5.1%.
(click to enlarge)
Again, we see enormous predictive power from this factor. The bottom decile boasted around 15% annual returns, while the top decile actually incurred a loss on average.
The reason for the success of value stocks is remarkably similar to that of small-caps. The perceived risk of value stocks is much greater than the real risk, and the difference can be effectively captured by investors. The natural progression of a company's business life is such that book to market ratio will decrease over time, causing an inward flow of funds by risk-averse investors, completely independent of other fundamentals. Therefore, in a highly diverse portfolio that screens out all factors other than book to market ratio, this flow of funds will become apparent and positive.
Yes... there is a relatively higher chance that a value stock will sputter and fail miserably, but in a diversified portfolio of such investments, the intrinsic value of these stocks is so underpriced on average, that investors get far more out of those that are successful than what they lose on those that fail. In other words, the average retail investor is so averse to the risk that they perceive in value stocks that they avoid them far more than they reasonably should.
SMB + HML = Alpha (mostly)
It should make sense that the size and value factors combine to create what we traditionally considered alpha from the CAPM model. There will always be other factors that cause some excess variance that we cannot predict, but they amount to a much smaller value of alpha. More importantly, we now have quantifiable explanatory factors rather than conveniently calling it "management prowess." By extension, it should begin to make sense that if we wish to maximize what we know as alpha, then we must develop a portfolio strategy which considers both size and value in some capacity. A portfolio which contains exclusively small-cap value stocks is what should theoretically yield the greatest returns, as long as both SMB and HML remain positive, as they have for any extended period of time in history.
(click to enlarge)
This gives a visual representation of both factors at work. Each flat surface represents 1 of 25 automatically created portfolios and its relative return, each partitioned by size and value characteristics. The red shaded block in the rear represents the smallest and most value oriented portfolio, while the green block in the front represents the largest and most growth oriented portfolio. Again, it is important to remember that not every short window of time will exhibit the same trend, but any extended period historically, and theoretically in the future, will look like this.
"Torturing The Data"
There are going to be a handful of readers that comment at the bottom that historical performance is not an indication of the future and that this should invalidate these analyses. Buffett/Graham style value investors usually cringe at the assertion that stock's returns could come from anything other than fundamentals and traditional value. However, we need to keep in mind that what we are observing is largely a product of human psychology. Repeatedly capturing the window in each company's business life in which the concentration of risk averse investors grows the most is what ensures that historical predictive power of these factors will continue.
A common critique of peering into the past is that one can always "torture the data" to reveal any sort of truth that we wish. However, consider that in each of the charts above, data follows the predictive hypothesis down to the very decile and utilizes many thousands of data points. Without exception, each marginally smaller decile of stocks outperformed, and with the exception of only a few deciles, each marginally more value-oriented decile outperformed. If you still believe that these charts are the results of "torturing the data," I'd say that Fama and French are the world's best interrogators.
Furthermore, the predictive power of the SMB and HML factors should open the eyes of many investors to the idea that active portfolio management and individual security selection may not be as important as CAPM suggested. At only 70% effectiveness in explaining returns, over 30% of returns can be quantitatively attributed to skilled portfolio management through CAPM (in the form of traditional alpha). After we graduate from CAPM to the Fama-French Three Factor Model, only about 4% of returns can be quantitatively pegged to management prowess, if not random variance. Consider that tiny 4% the next time you see a steep management fee on promising fund.
Using Multiple Systematic Risk Factors
I will go so far as to say that the claims made above are bold, considering I've made predictions as to what will continue to be the best performing stocks of the long term future. However, there is another important strategy that can be derived from Fama-French factors that even the most skeptical should be able to rationalize.
Standard use of CAPM involves catering an investor's level of portfolio beta to his or her risk appetite. For example, a financial advisor might target a portfolio beta of 0.5 for investor planning to retire next year, and a portfolio beta of 1.5 for an investor who has no immediate need for income. This is because the use of CAPM assumes that exposure to the market is the sole measure of systematic risk, and by extension, it will always have a value relative to the market. In other words, we cannot simply eliminate systematic risk by diversifying our portfolios, like we can with unsystematic risk.
Introducing two more significant systematic risk factors, SMB and HML, we now have a way to quantitatively measure systematic risk through more than just beta. In the past, and to most investors today, these factors are simply considered "styles." To illustrate, most investors are familiar with the Morningstar Investing Style Box, shown below...
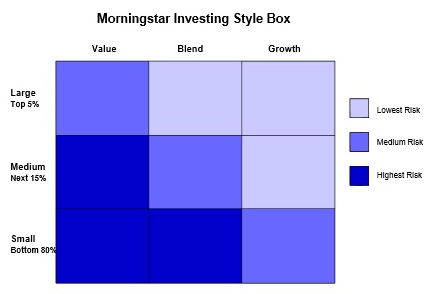
Notice that in addition to considering these factors "styles," the matrix partitions market cap by the bottom 80%, next 15%, and top 5% and gives no clear idea of how value/growth is defined (specific multiples used). Most importantly, the Morningstar Investing Style Box gives investors no quantitative measure of exposure to either of these factors. In other words, suppose that through Morningstar Investing Style Box designation, a company sits in the bottom-most, left-most corner (small cap, value). We have no way of knowing if these designations are positively correlated to their corresponding factors. If that company underperforms on average when SMB is positive and overperforms on average when SMB is negative, we would say that that company is inversely correlated to SMB and acts much like a large company, despite obviously being a small company.
Remember that the Fama-French Model does not say that small caps will always outperform large caps; it says that each equity or portfolio, when regressed against the SMB factor, will have a specific level of exposure to that factor. If the regression yields 0.5, one would say that when the smallest 50% of equities in the market outperforms the largest 50% of equities on an absolute basis of 1%, the given stock will outperform by 0.5%. If the regression yields -2.0, one would say that, under the same conditions as above, the given stock will underperform by 2%. In this way, each company has a measurable level of exposure to both SMB and HML in the same way they have exposure to the market through beta.
Clearly, exclusive use of traditional beta and reliance on the Morningstar Investing Style Box are poor measures of a portfolio's systematic risk. The following is a more practical graphical representation of how an investor can easily assess exposure to SMB and HML factors (note that I have switched book to market ratio back into P/B, since most investors are used to this measure).
(click to enlarge)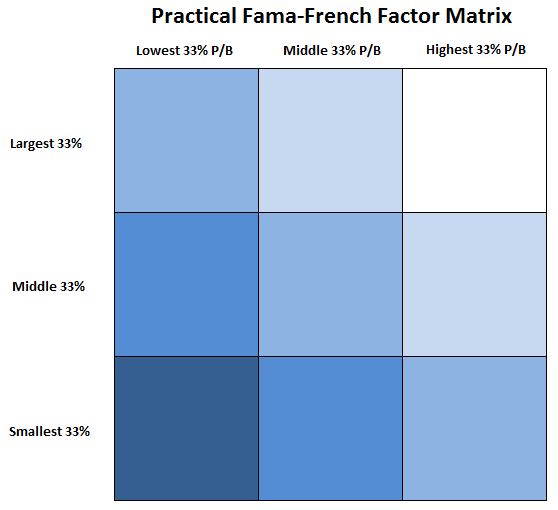
Again, the darker shades of blue represent higher levels of historical volatility on average, and therefore higher performance when SMB and/or HML factors are positive. It provides a much more accurate way of looking at a portfolio or individual equity in terms of Fama-French factors than the Morningstar Investing Style Box. I read an SA article recently that gives some useful information on inferred exposure to the SMB factor for a plethora of popular ETFs.
We can go one step farther (though it takes quite a bit more time and effort). By providing a level of measured exposure over a trailing period of time, we can see whether the portfolio or individual equity is positively or negatively correlated and to what degree. Consider the following chart, which plots some basic ETFs by their level of exposure...
(click to enlarge)
Red zones represent positive correlation of both size and value, while blue zones represent inverse correlation of both size and value. Purple zones represent a combination of both direct and inverse correlations. Remember that positive correlation indicates that smaller and value portfolios or ETFs will outperform when SMB and HML are positive, respectively.
For those unfamiliar, the 7 ETFs plotted are Large Cap Growth (SPYG), Large Cap Value (SPYV), Mid Cap Growth (MDYG), Mid Cap Value (MDYV), Small Cap Growth (SLYG), Small Cap Value (SLYV) based on S&P indexes, and Micro Cap (IWC) based on Russell indexes.
After plotting all 7, several things are clear. First, there are no surprises in terms of how the ETFs are oriented in relation to each other. Second, actual exposure to size and value factors are sometimes not what one would expect. For example, the Large Cap Growth ETF has a positive 0.093 correlation to monthly SMB, indicating that the fund will actually outperform by a small amount when smaller stocks are outperforming, despite being labeled a large cap fund. Third, all of these highly diversified ETFs, including the Micro Cap ETF, fail to achieve exposure of more than 1.0 to either factor. While much of this is due to the amount of returns already explained by correlation to the market (AKA beta), it is clear that most diversified ETFs fail to capture the real power of these factors.
Final Thoughts
I have no doubt that the biggest critique of these analyses lies in the claim that we cannot depend upon the past to predict the future. However, I will counter with a phrase my father is fond of using: "History repeats itself." Natural human tendencies toward risk aversion are the same now as they were a thousand years ago. Looking into the past allows us to get a better understanding of how these tendencies are likely to constitute themselves in the future. Finally, keep in mind that even the smallest consistency in predictable human behavior can be turned into a fruitful portfolio strategy if captured enough times with high frequency.
Unless otherwise stated, my charts and factual data came from the following sources, or were constructed by me with data from the following sources...
calculatinginvestor.com - Fama-French Factor Loadings For Popular ETFs
Kenneth R. French - Data Library
Size: The Second Factor Of Investing (David Marotta)
Atlas Capital Advisors LLC - Factor Model Basics
Disclosure: I have no positions in any stocks mentioned, and no plans to initiate any positions within the next 72 hours. I wrote this article myself, and it expresses my own opinions. I am not receiving compensation for it (other than from Seeking Alpha). I have no business relationship with any company whose stock is mentioned in this article. (More...)
This entry passed through the Full-Text RSS service — if this is your content and you're reading it on someone else's site, please read the FAQ at fivefilters.org/content-only/faq.php#publishers.
Aucun commentaire:
Enregistrer un commentaire