It's no secret that historically stocks tend to do well in January. Particularly, small stocks make the largest gains in a phenomenon known as the "January Effect." The basic theory is that abnormally high January gains are the market's way of compensating for abnormally high selling in December by investors hoping to offset their year's taxable capital gains. In other words, investors sell in December for tax reasons and repurchase in January to start the new taxable year.
It has been said that the January Effect has not been as pronounced in recent years because investors seem to be more aware of it, though the numbers speak for themselves. If we look at the absolute difference between the returns of the smallest 50% of stocks and the returns of the largest 50% of stocks, we find that the arithmetic average difference over the past 10 January's is 0.77%, while the arithmetic average difference for all months in the past 10 years is 0.27% (as measured by Fama and French's SMB factor). This effect may seem small, but this article will discuss how certain ETFs can be used to leverage this effect.
It should be noted that attempting to capture gains from the January effect is, on average, a smart investing decision (small stocks will outperform in January on an average basis over many years), but it comes with significant risk. For example, small stocks underperformed their large counterparts by 2.05% in 2011, only to outperform them by 2.80% in 2012. Any investor looking into the January effect should be aware that this is far from a risk free strategy, and individual years may be exceptions to the effect.
Here is where things get dicey for most people. If you are not interested in the technical methodology, feel free to skip down to the worst and best ranked lists below. For everyone else, I will lay out how I selected the best and worst ETFs.
January Effect Levering
Our January Effect strategy comes in three basic stages. Given the basic premise that small stocks will outperform large stocks in January (supported by plenty of data), the goal is to...
1. Test which investments have statistically significant exposure to the January Effect (SMB factor).
2. Measure the magnitude by which they will likely be exposed to the effect (SMB factor).
3. Select the appropriate level of exposure for one's individual risk appetite.
Testing For Statistical Significance
Measuring exposure to a nebulous, psychological effect is no easy task. However, the work of Fama and French and their Three Factor Model provides the perfect framework. Their model includes a factor called SMB, which measures the difference between small company returns and large company returns. In much the same way we can calculate beta (AKA exposure to the market) by performing a regression analysis against the market's returns, we can calculate exposure to small company outperformance by performing a regression analysis against historical monthly values of SMB. You can find a basic explanation of regression here, if you need a memory jog. The research of Fama and French tells us that many stocks, and especially ETFs, will have a statistically significant level of exposure to SMB. In other words, on a monthly basis, there is a certain amount of any given ETF's price movement that is dependent on the value of SMB.
In the regression, a critical probability of 0.05 was used. In other words, in order to claim that a given ETF is significantly correlated to the SMB factor, the regression must say that there is less than a 5% chance that the ETF's returns and SMB are not correlated (this is how a regression works). Of the 55 ETFs tested, 49 passed as being correlated, while 6 failed. These 6 ETFs deserve a mention as the worst small cap ETFs for taking advantage of the January Effect...
Worst ETFs For The January Effect
1. PowerShares S&P SmallCap Utilities (PSCU) - 7% chance of no correlation
2. SPDR Russell 2000 Low Volatility (SMLV) - 93% chance of no correlation
3. PowerShares S&P SmallCap Low Volatility (XSLV) - 68% chance of no correlation
4. PowerShares S&P SmallCap Financials (PSCF) - 11% chance of no correlation
5. PowerShares DWA SmallCap Technical Leaders (DWAS) - 10% chance of no correlation
6. PowerShares S&P SmallCap Consumer Staples (PSCC) - 9% chance of no correlation
Bear in mind that I am not saying that these are bad ETFs in general. The data is saying that there is more than a 5% chance that they are not at all correlated to the SMB factor. For all other small cap ETFs, there is less than a 5% chance of no correlation, and for most, there is almost a 0% chance of no correlation.
Calculating SMB Exposure
With the remaining 49 ETFs, I performed a multiple regression analysis to measure exposure to Fama and French's Rm-Rf factor (market returns minus the risk free rate, or what beta is calculated from), the SMB factor, and HML factor (calculated by the absolute difference in returns between the 50% of stocks with the lowest P/B and the 50% of stocks with the highest P/B, also known as value versus growth). Together, these three factors have been shown to explain approximately 96% of returns since the 1920s.
What these regressions give us is a level of exposure to each factor. For example, if the regression tells us that an ETF's exposure to every one of the factors is 2.00, then the model predicts that its returns will be equal to double the monthly returns of the market plus double the monthly value of SMB plus double the monthly value of HML. Ideally, to take advantage of the January Effect, we would like the ETF to have the highest possible exposure to SMB and the lowest possible exposure to the market and HML. To measure this tradeoff, I measured the percent of factor exposure attributable to SMB. In other words, I sorted by the ETFs whose total factor exposure is most explained by SMB. They are as follows...
Top Risk Adjusted ETFs For The January Effect
(click to enlarge)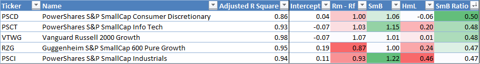
My top ETF pick for January is PowerShares S&P SmallCap Consumer Discretionary (PSCD). The regression model explains 86% of returns (adjusted R square) and tells us that the ETF is exposed to SMB by a coefficient of 1.06. While it is still exposed to the market by a coefficient of 1.00, it has the advantage of having almost no exposure to the HML factor.
Rounding out my top 5 are PowerShares S&P SmallCap Info Tech (PSCT), Vanguard Russell 2000 Growth (VTWG), Guggenheim S&P SmallCap 600 Pure Growth (RZG), and PowerShares S&P SmallCap Industrials (PSCI). As you can see by the ratio on the far right, all 5 of these ETFs' returns are almost 50% explained by the SMB factor. There are other ETFs who are more exposed to SMB on an absolute basis, but they are also more highly exposed to the other factors, and are less attractive on a risk adjusted basis. With this in mind, the top ETFs by pure SMB exposure are as follows...
Top ETFs For The January Effect (Not Adjusted For Risk)
(click to enlarge)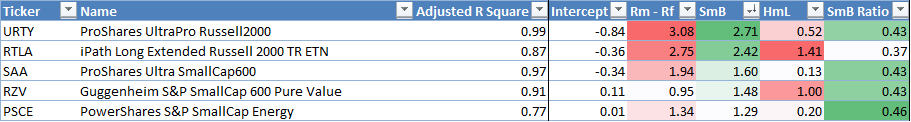
The top 3 ETFs, ProShares UltraPro Russell2000 (URTY), iPath Long Extended Russell 2000 TR ETN (RTLA), and ProShares Ultra SmallCap600 (SAA) owe their high SMB exposure to being levered ETFs. The inevitable consequence of levering an ETF is that all factors' exposures are also levered, as you can see by the fact that all 3 are more exposed to Rm-Rf (the market's returns) than to SMB. Generally, the objective of levered ETFs is to match a multiple of daily returns of their named index, and will result in highly volatile daily returns for the ETF, but may pay off in January for those willing to stomach the high exposures. Remember that these ETFs are intended to be used for "short-term investing," which is exactly what we would like to do here. For most investors, I would not advise using them over the risk-adjusted picks above, but this is a perfect example of a strategy for which they were intended if you are a fan of riskier plays.
Number 4 on our list is Guggenheim S&P SmallCap 600 Pure Value (RZV), which has by far the highest raw exposure to SMB of any unlevered ETF. This ETF is extremely compelling, except for its high exposure to the HML factor, which makes sense, given its stated strategy of holding value stocks. If you believe value stocks will also outperform in January, this is certainly your first choice.
Rounding out our list at number 5 is PowerShares S&P SmallCap Energy (PSCE), with an SMB exposure of 1.29. This ETF is not a bad play, but its weaknesses are a high level of exposure to market returns and a low level of adjusted R square, meaning the model as a whole is somewhat less effective at explaining its returns. In other words, there will likely be a certain degree of returns that we cannot explain with any of these factors.
Final Thoughts
My personal belief is that volatility has the most capacity for returns, so my choice would be to opt for maximum SMB exposure and risk, but I'm also only 20 years old. However, I recognize that it's likely the top risk adjusted ETFs make more sense for most retail investors' goals.
There are dozens of other small-cap ETFs tested in the analysis that I have not shown here. If you are curious about a specific ETF's regression, exposure, significance, or predictive model, leave a comment and I will get back to you. Also, if you believe a non-small-cap ETF may have significant exposure to the January Effect, I will gladly test for you if you comment with a ticker.
Disclosure: I have no positions in any stocks mentioned, and no plans to initiate any positions within the next 72 hours. I wrote this article myself, and it expresses my own opinions. I am not receiving compensation for it (other than from Seeking Alpha). I have no business relationship with any company whose stock is mentioned in this article. (More...)
This entry passed through the Full-Text RSS service — if this is your content and you're reading it on someone else's site, please read the FAQ at fivefilters.org/content-only/faq.php#publishers.
Aucun commentaire:
Enregistrer un commentaire