This article will look at 30 different sector ETFs in ten sector categories to see what upside price goals are realistic at present, how often such goals were reached in the past, what size gains, net of losses, were achieved previously, and how bad a price drawdown scare had to be endured on the way to those prizes.
We will draw on the price range forecasts produced by Intelligent Behavioral Analysis of the way that market-making professionals (MMs) hedge their firm's at-risk positions. Positions that they must take, helping their big-money-fund clients as the clients use these ETFs to adjust their portfolios' make-ups. To evaluate how well those forecasts may be accomplished in the next few months, we will look to the past five years' experiences at the times when specific ETF outlooks had the same upside-to-downside balance they have now.
Sector Focus Among ETFs
Sector ETFs are provided by three principal sources, Standard & Poor's' SPDR offerings, Vanguard ETF creations, and i-Shares products from BlackRock, plus a few by others. They tend to duplicate one another in their focus and contained holdings, but for reasons not entirely clear, the market performances, while often similar, are usually not identical.
Here are the ETFs, grouped by their focus, with symbols and names:
DBE POWERSHARES DB ENERGY FUND
IYE DJ US ENERGY SECTOR iSHARES
VDE VANGUARD ENERGY ETF
XLE S&P ENERGY SECTOR SPIDER
IYH DJ US HEALTHCARE SEC iSHARES
VHT VANGUARD HEALTH CARE ETF
XLV S&P HEALTH CARE SECTOR SPDR
IGV S&P NA TECH-SOFTWARE SECTOR
IYW DJ US TECHNOLOGY SECTOR INDEX
VGT VANGUARD INFORMATION TECHNOLOGY
XLK S&P TECHNOLOGY SECTOR SPIDER
XSD S&P SEMICONDUCTOR SPDR
IYF DJ US FINANCIAL SECTOR iSHARES
IYG DJ US FINANCIAL SERVICES iSHARES
VFH VANGUARD FINANCIALS ETF
XLF S&P FINANCIAL SECTOR SPIDER
FXD FIRST TRUST CONSUMER DISCRETIONARY ETF
VCR VANGUARD CONSUMER DISCRETIONARY ETF
XLY S&P CONSUMER DISCRETIONARY SECTOR SPDR
VDC VANGUARD CONSUMER STAPLES
KXI iSHARES GLOBAL CONSUMER STAPLES
XLP S&P CONSUMER STAPLES SECTOR SPIDER
XRT S&P RETAILING SPDR
IDU DJ US UTILITIES iSHARES
VPU VANGUARD PUBLIC UTILITIES
XLU S&P UTILITIES SECTOR SPIDER
IGE GSSI S&P NATURAL RESOURCES INDEX iSHARE
IYM DJ US BASIC MATERIALS iSHARES
VIS VANGUARD INDUSTRIALS ETF
XLB S&P BASIC INDUSTRIES SPIDER
XLI S&P INDUSTRIAL SECTOR SPIDER
XME S&P METALS & MINING SPDR
MOO MARKET VECTORS AGRICULTURAL ETF
IYT DJ US TRANSPORTATION AVERAGE ETF
And here are the current upside vs. downside price change forecasts implied by market-maker hedging activities:
(click to enlarge) (used with permission)
In the above mapping, ETFs with more attractive buy prospects are down and to the right, while scarier propositions are above the diagonal line, that space where price change directions appear of equal potential. Note that the diversification effect of many holdings in a fund tend to limit the size of overall change expectations, in both directions, up and down.
From this single criterion, IYM at [5], a basic materials sector ETF, has the advantage of only fractional downside forecast, and 6% upside prospect - at its current price, at this point of appraisal. Further examination reveals that 33 previous instances of its current balance of up to down prospects in the past 2 ½ years of its complete existence have been followed by profitable experiences in 7 out of every 8 cases when following a standard simple strategy.
These are not long-term economic forecasts of where the economic sectors are likely to go. They are price change possibility forecasts, specific to the individual ETF. Experience shows that they are most useful in a 4-6 month outlook period, where market "noise levels" offer profit opportunities at annual rates of gain that are typically multiples of the pace of gain from buy-and-hold investment practice.
The IYM experience highlights the need to evaluate how well the MMs have been able to appraise each security or ETF. To that end we have developed a standard, practical test.
Each ETF's current forecast upside to downside balance is compared to every similar daily forecast in the past 5 years to find how subsequent market quotes evolved. The standard test is how long it took to reach the price range high of the forecast, or if not reached in 3 months, what average price changes were achieved, including closeouts at 3 months. Also noted are the percentage of profitable experiences, the average holding period and the annual rate of return achieved by these prior like experiences. The worst-case price drawdowns following the forecasts are also averaged.
Importantly, investment risk is NOT properly measured by volatility of price, which also includes upside variance from its mean, but is instead the exquisite discomfort experienced by being in a losing-money position. That is when investors are far more inclined to do dumb things than when they are ecstatic about how smart they have been to get so far ahead. So we are concerned about stress situations.
To provide some perspective, here are averages of the ETFs by sector focus, grouped as they are in the symbol and name list earlier in this article. An important thing to note here is the proportion of forecasts in each sector that have been profitable, coming from the aggregated sector's prior ETF forecasts that are like the upside to downside outlooks seen now. (Win Odds/100) We know that high odds for profit are one of the more important factors in generating attractive rates of return.
The most right-hand column teams up those odds on the Upside Forecast Potential and its complement with the Drawdown exposure to get an odds-weighted net of both sides of each aggregate sector proposition.
(click to enlarge)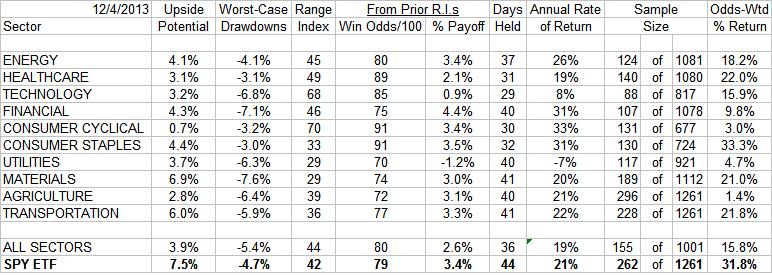
The most attractive sector trade-offs at this point in time and prices appear to be in Consumer Staples, by a large margin. That odds-weighted comparative yardstick shows 1 ½ times as much appeal there as for the next closest sectors of Healthcare, Materials and Transportation. Utilities and Agriculture appear to have the least prospective appeal here.
The SPDR S&P500 Index ETF (SPY) is included as a market contrast, in addition to the All Sectors data. It is basically competitive on the odds-weighted basis with Consumer Staples.
A similar detail is available for each of the ETFs themselves, as noted below:
(click to enlarge)
Disclosure: I have no positions in any stocks mentioned, and no plans to initiate any positions within the next 72 hours. I wrote this article myself, and it expresses my own opinions. I am not receiving compensation for it (other than from Seeking Alpha). I have no business relationship with any company whose stock is mentioned in this article. (More...)
This entry passed through the Full-Text RSS service — if this is your content and you're reading it on someone else's site, please read the FAQ at fivefilters.org/content-only/faq.php#publishers.
from SeekingAlpha.com: Home Page http://seekingalpha.com/article/1882661-best-current-buy-target-for-emphasis-among-sector-etfs?source=feed
Aucun commentaire:
Enregistrer un commentaire