In two previous articles[1] I've made the case for an extremely gradual transition from ever-lower interest rates (1980-2013) to one of a sideways - or moderately-rising - interest rate environment. I came to this conclusion based on historical examples from the previous rising interest-rate cycle of 1945-1980 when the U. S. economy was so robust that interest rates and inflation rose for 30 years.
It was a time of strong population growth and family formation. There were employment and wage gains, a burgeoning middle class; and of course, housing starts (new home construction) that rose along with the cost of credit. The important thing to note, however, is that the heightened cost of credit back then did not appreciably slow the housing market. The housing market ebbed and flowed because of employment gains.
There were several boom/bust cycles for housing starts during the 30 years, each one beginning from a bottom of 850,000(+/-) annualized and rising to 1.8 ML (1964), 1.8 ML (1969), 2.4 ML (1973), 2.2 ML (1978), and 2.2 ML (1984). The important thing to note is that the population in 1950 (151.3 ML) was less than half what it is today (330 ML); yet the long-term average of 1.5ML starts per year and 15ML starts per decade has remained relatively constant. It appears this "run rate" is synchronized with our population growth of 10% per decade. Those 30 years were a prosperous time for the construction industry; a time of great capital-intensive investment and infrastructure development.
In each economic recovery, housing starts bottomed during a recession and led the economy out of it. Our current recovery (2009-2013) is one of the few times in the modern era when housing starts have not led the economy out of a recession, which begs the question, just how much of an actual recovery have we had?
Some strategists opine we will simply muddle-through with the same gradual growth until it eventually resolves the conundrum of our split-level recovery.
Jeffrey Saut, the chief investment strategist for Raymond James, recently reiterated a comment made by another strategist, Jim Swanson, of MFS, that the 2% growth we have been experiencing is "organic, simple and self-sustaining", and will likely outlast previous cycles by several years (the average is 60 months).
Secondly, Mr. Saut suggests we consider our new bull market from the valuation low of October 4, 2011, rather than the nominal low of March, 2009.
"My view is that pundits don't measure the 1982 to 2000 secular bull market from the December 1974 "nominal price low," but rather from the "valuation low" of August 1982. Therefore, we should not measure the current bull move from the March 2009 "nominal price low," but rather from the "valuation low" of October 4, 2011. QED, we are not 56 months into this move, but 25 months; and, for the record, the average duration of a bull move is 50 months." ("That Was the Week That Was?!" November 11, 2013)
In this regard, the concurrent bottom for the housing cycle on October 4, 2011 makes better sense, and implies we are only 25 months into the housing recovery as well.
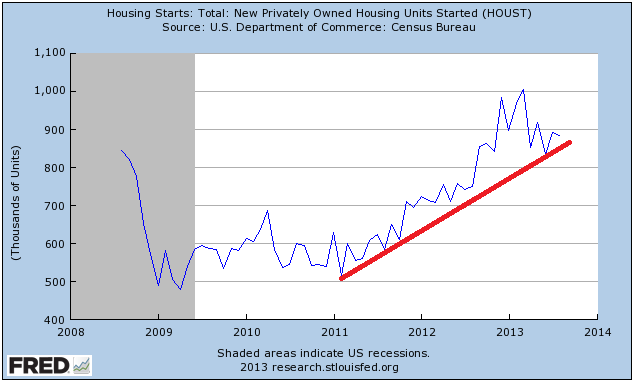
(Click to enlarge)
Of note, at 883,000 starts annually, the housing recovery has now ascended to the previous lows of all recession lows for starts!
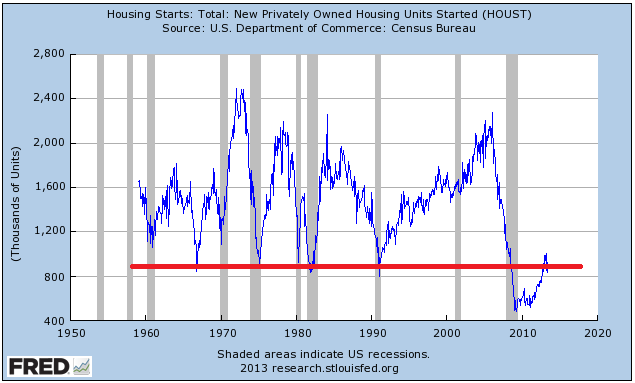
(Click to enlarge)
In order to supply housing for current population growth - and to replace the construction that did not occur between 2007-2012 - the U.S. needs 6ML additional housing starts in the next 4 years . The only way to alleviate this supply constraint will be to make more supply.
Which leads me to a comment on the current state of the bond market. The yield curve is steepening again, a process that always occurs ahead of the hope of a robust economy.
Since the recession ended in 2009, the high-side of the yield curve has topped-out above 4.65% (TYX), some 80 basis points above where we are now. But each time the Federal Reserve ceased its stimulus programs (QE), the long end of the curve quickly cooled and interest rates dropped.[2]
Comments out of the Fed this autumn seem to indicate that it has learned from its "taper on/taper off?" controversy and will continue its latest stimulus farther into the recovery than it previously deemed necessary.
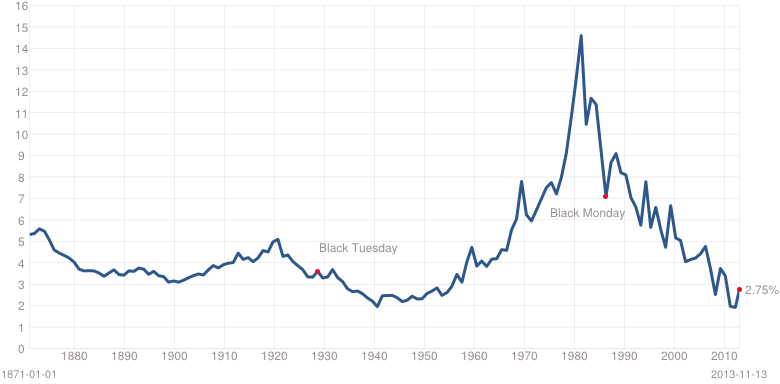
So where does that leave interest rates? At an historic technical juncture. The long-term trend has been down for 32 years. Is it now about to change? That is the question lurking behind all the volatility and panic in fixed income.
From Freestockcharts.com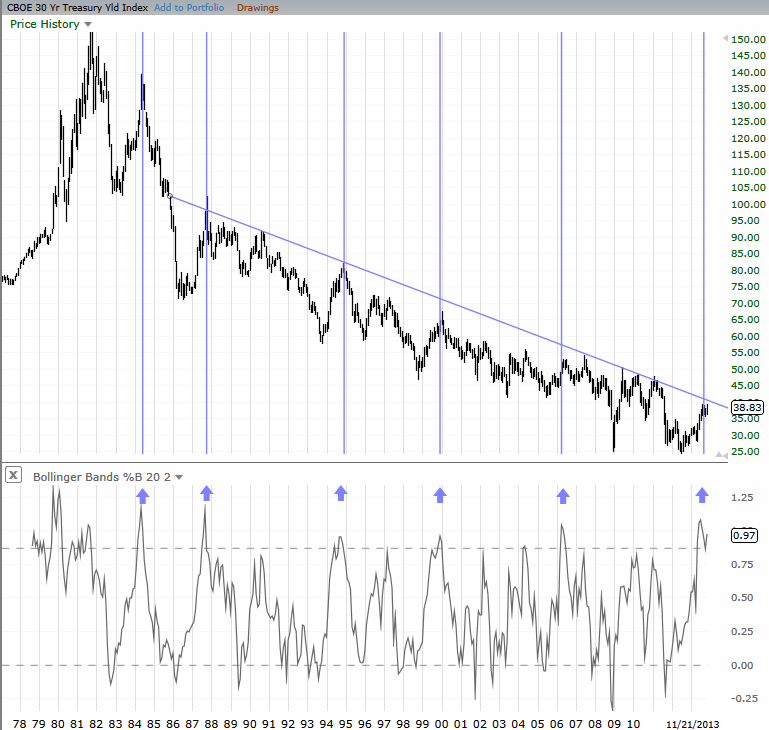
(Click to enlarge)
After each spike in rates over the past 3 decades (blue arrows, above), rates eventually receded lower.
Here is another way to look at the same trend through the TLT (ProShares leveraged 20-year Treasury Yield)
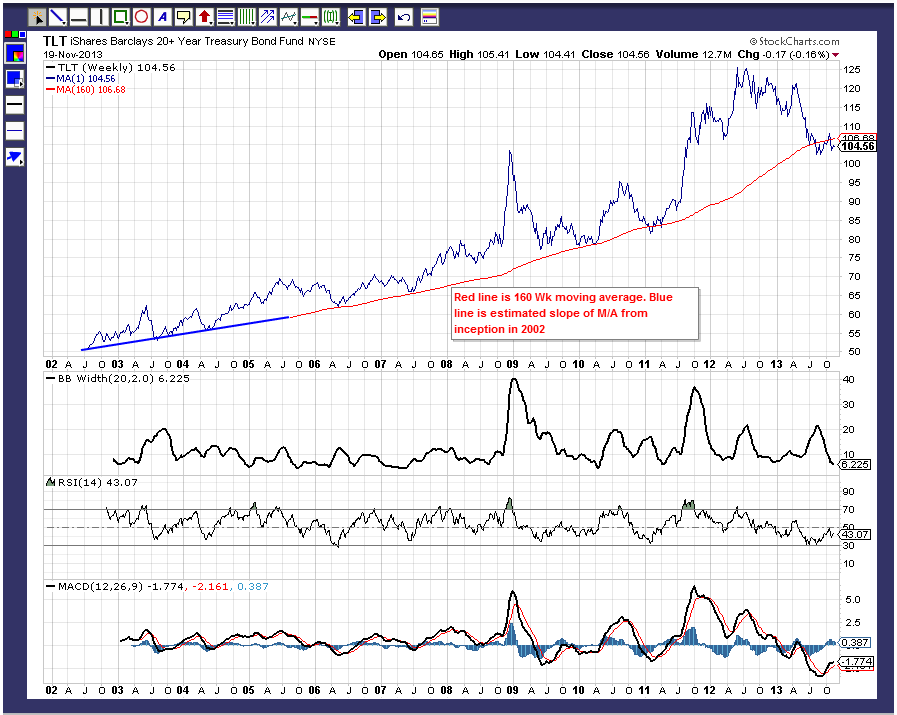
(Click to enlarge)
This has been a very long trend for a very long time. What kept it going?
"Growth in the capacity to borrow has replaced income growth over the last 30 years. Of course this is possible because interest rates have been falling continuously since the early 1980s making it feasible to borrow more and more with less income.
If we wanted to increase purchasing power in an environment where interest rates were not in decline, we'd need to see a substantial increase in real median income. For instance, say 30-year mortgage rates were at 6.5% instead of their recent level of roughly 3.5% (April, 2013). All else being equal, to get the same purchasing power as a 3.5% mortgage rate with a mortgage rate of 6.5% would require a 41% increase in real income!" [3]
Apparently the bond market sees this kind of job growth ahead for 2014-15 and is front-running the Federal Reserve. But it has not shown up on the BLS charts (yet).

(Click to enlarge)
For new employment growth to be sustainable, there needs to be a paradigm shift from low to no-growth in wages combined with ever-lower interest rates (1982-2013) to a higher growth in personal income (wages) accompanying the net rise in rates.
In the aftermath of the Great Depression (1935-1957) - an economic time similar to our own - the TNX stayed under 3% for two decades. It took a significant amount of time, inflation, and employment gains for the TNX to rise again above 3%.
From my vantage point, if there are wage and job gains ahead, the rise in rates will be gradual, but even so, home builders will benefit. And if the Federal Reserve tapers the stimulus - and it cools the economy - and interest rates go down from here, this will also benefit the home builders because affordability of homes will increase.
The home builders have said that a rise in interest rates in 2014 would only occur amidst a strengthening economy, and if that happened, it would increase their volumes, not diminish them.
The current negative mind-set around the housing recovery is:
- Strengthening economy = better employment picture = higher interest rates = less home sales
- Weakening economy = poorer employment picture = lower rates = less home sales
The flip side:
- Strengthening economy = better employment picture = more home sales (but with higher rates)
- Weakening economy = poorer employment picture = lower rates but more home sales (better affordability)
Homebuilders today are a statistically smaller group than they were in 2006. They have very little short-term debt, are well-capitalized at low fixed-rates, and follow a data-driven construction model based on housing-permits/to employment. Most of them have 7-10 years of land - their single biggest expense - controlled or under option. A profitable business environment should lie ahead for them.
Maybe we are on the cusp of a sweeping transition, rising off the lows created by the Great Recession. America has had previous generational swings from a service-oriented economy to capital intensive development before.
But the point taken from a past history is it was gradual back then, not a linearity of spikes, hikes, and retractions. I think the transparency of the current Federal Reserve will yield a much more measured pace in monetary policy than the bond market now assumes. It does not currently seem to believe this, but I think it will become so, and when it does, home builders will resume the secular bull market in housing. The recent attainment of the 1 ML mark in permits indicates housing is gaining steam as we move into the Spring.
**********************************************
1(a) Important Lessons For Housing From The Government Crises Of 2011 And 2013 , J Gilluly, November 6, 2013
1(b) 4.5% Mortgage Rates For The Remainder Of The Decade? , J Gilluly, September 10, 2013
2. Quantitative Easing Myths , by Scott Grannis, November 19, 2013
3. Growth in Mortgage Purchasing Power , Department of Numbers #, April 3, 2013
Disclosure: I am long BRP, TPH, KBH. I wrote this article myself, and it expresses my own opinions. I am not receiving compensation for it (other than from Seeking Alpha). I have no business relationship with any company whose stock is mentioned in this article. (More...)
This entry passed through the Full-Text RSS service — if this is your content and you're reading it on someone else's site, please read the FAQ at fivefilters.org/content-only/faq.php#publishers.
from SeekingAlpha.com: Home Page http://seekingalpha.com/article/1871271-are-bonds-on-a-collision-course-with-housing-history-and-the-fed?source=feed
Aucun commentaire:
Enregistrer un commentaire