For investors looking for a large-cap company in a sector poised for growth, Transocean Inc. (RIG) is a growth-oriented, offshore oil and gas drilling company with many catalysts that will increase shareholder value.
Transocean Ltd. provides offshore contract drilling services for oil and gas wells worldwide. The company specializes in deepwater and harsh environment drilling, oil and gas drilling management, drilling engineering and drilling project management services, as well as logistics services.
In a recent article I published "A $70 valuation trading in the low $50" I looked at some improving debt issues within the company as well as some cash flow improvements moving forward.
In the section below, I will analyze aspects of Transocean's past performance. From this evaluation, we will be able to see Transocean's profitability, debt and capital, and operating efficiency. Based on this information, we will look for strengths and weaknesses in the company's fundamentals. This should give us an understanding of how the company has fared over the past few years and will give us an idea of what to expect in the future.
Profitability
Profitability is a class of financial metrics used to assess a business's ability to generate earnings compared with expenses and other relevant costs incurred during a specific period of time. In this section, we will look at four tests of profitability. They are: net income, operating cash flow, return on assets and quality of earnings. From these four metrics, we will establish if the company is making money and gauge the quality of the reported profits.
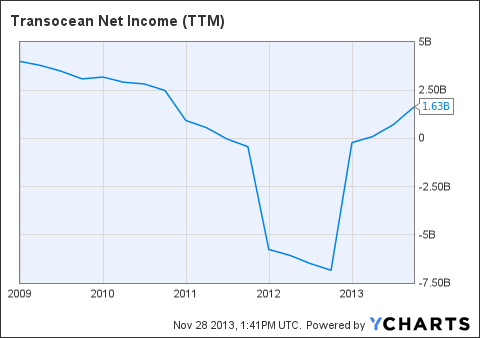
- Net income 2010 = $961 million
- Net income 2011 = $(5.725) billion
- Net income 2012 = $(219) million
- Net income 2013 TTM = $1.630 billion
Since 2010 Transocean's net profits have increased from $961 million in 2010, to $1.630 billion in 2013 TTM. This represents a 58.96% increase.
 TTM) Chart">
RIG Net Income (TTM) data by YCharts
- Operating income 2010 = $2.730 billion
- Operating income 2011 = $(4.762) billion
- Operating income 2012 = $1.581 billion
- Operating income 2013 TTM = $2.358 billion
Operating income is the cash generated from the operations of a company, generally defined as revenue less all operating expenses, but calculated through a series of adjustments to net income.
Over the past three years and a half years Transoceans' operating income has decreased from $2.730 billion to $2.358 billion in 2013 TTM. This represents an decrease of 15.78%.
ROA - Return On Assets = Net Income/Total Assets
ROA is an indicator of how profitable a company is relative to its total assets. ROA gives an idea as to how efficient management is at using its assets to generate earnings. Calculated by dividing a company's net income by its total assets, ROA is displayed as a percentage.
Net income growth
- Net income 2010 = $961 million
- Net income 2011 = $(5,725) billion
- Net income 2012 = $(219) million
- Net income 2013 TTM = $1.630 billion
Total asset growth
- Total assets 2010 = $36.811 billion
- Total assets 2011 = $35.088 billion.
- Total assets 2012 = $34.255 billion.
- Total assets 2013 TTM = $32.601 billion.
ROA - Return on assets
- Return on assets 2010 = 2.61%.
- Return on assets 2011 = (16.79)%
- Return on assets 2012 = (6.39)%.
- Return on assets 2013 TTM = 5.00%
Over the past three years Transocean's ROA has increased from 2.61% in 2010 to 5.00% in 2013 TTM. The ROA of (16.79)% and (6.39)% respectively are due to lawsuits and penalties regarding the Gulf disaster.
Debt And Capital
The Debt and Capital section establishes if the company is sinking into debt or digging its way out. It will also determine if the company is growing organically or raising cash by selling off stock.
Total Liabilities To Total Assets, Or TL/A ratio
TL/A ratio is a metric used to measure a company's financial risk by determining how much of the company's assets have been financed by debt.
Total assets
- Total assets 2010 = $36.811 billion
- Total assets 2011 = $35.088 billion.
- Total assets 2012 = $34.255 billion.
- Total assets 2013 TTM = $32.601 billion.
- Equals an decrease of $4.210 billion
Total liabilities
- Total liabilities 2010 = $15.428 billion
- Total liabilities 2011 = $19.387 billion
- Total liabilities 2012 = $18.510 billion
- Total liabilities 2013 TTM = $16.327 billion
- Equals an increase of $899 million
Over the past three and a half years, Transocean's total assets have decreased by $4.210 billion, while the total liabilities have increased by $899 million. As the company has been selling off its older assets to focus on harsh weather assets this is indicated in the TL/A ratio.
Working Capital
Working Capital is a general and quick measure of liquidity of a firm. It represents the margin of safety or cushion available to the creditors. It is an index of the firm's financial stability. It is also an index of technical solvency and an index of the strength of working capital.
Current Ratio = Current assets / Current liabilities
Current assets
- Current assets 2010 = $6.195 billion
- Current assets 2011 = $7.609 billion
- Current assets 2012 = $8.647 billion
- Current assets 2013 TTM = $7.373 billion
Current liabilities
- Current liabilities 2010 = $3.836 million
- Current liabilities 2011 = $5.358 billion
- Current liabilities 2012 = $5.463 million
- Current liabilities 2013 TTM = $3.776 million
- Current ratio 2010 = 1.61
- Current ratio 2011 = 1.42
- Current ratio 2012 = 1.58
- Current ratio 2013 TTM = 1.95
Over the past three and a half years, Transocean's current ratio has increased. As the current ratio is well above 1, this indicates that Transocean would be able to pay off its obligations if they came due at this point.
Common Shares Outstanding
- 2010 shares outstanding = 320 million.
- 2011 shares outstanding = 322 million.
- 2012 shares outstanding = 356 million
- 2013 TTM shares outstanding = 361 million
Over the past three and a half years, the number of company shares have increased from 320 million to 361 million.
Operating Efficiency
Operating Efficiency is a market condition that exists when participants can execute transactions and receive services at a price that equates fairly to the actual costs required to provide them. An operationally efficient market allows investors to make transactions that move the market further toward the overall goal of prudent capital allocation without being chiseled down by excessive frictional costs, which would reduce the risk/reward profile of the transaction.
Operating Ratio = Operating Expenses / Revenue
A ratio that shows the efficiency of a company's management by comparing operating expenses to net sales.
Operating Expenses
- Operating Expenses 2010 = $1.000 billion
- Operating Expenses 2011 = $6.610 billion
- Operating Expenses 2012 = $1.509 billion
- Operating Expenses 2013 TTM = $1.384 billion
Total Revenue
- Revenue 2010 = $7.949 billion
- Revenue 2011 = $8.027 billion.
- Revenue 2012 = $9.196 billion.
- Revenue 2013 TTM = $9.478 billion
Operating Ratio
- Operating Ratio 2010 = 12.58%.
- Operating Ratio 2011 = 82.34%
- Operating Ratio 2012 = 16.41%.
- Operating Ratio 2013 TTM = 14.60%
When looking at Transocean's operating ratio, you can see that ratio has increased over the past three and a half years. The operating ratio spiked in 2011 but has come back down to safer levels. Even though the operating ratio is currently 14.60% it is still higher than it was in 2010. This indicates that the operating expenses have increased at a higher level from a percentage point of view than the revenue. A decrease in this metric indicates a strengthening in profitability.
Gross Margin: Gross Income/Sales
The Gross Profit Margin is a measurement of a company's manufacturing and distribution efficiency during the production process. The gross profit tells an investor the percentage of revenue/sales left after subtracting the cost of goods sold. A company that boasts a higher gross profit margin than its competitors and industry is more efficient. Investors tend to pay more for businesses that have higher efficiency ratings than their competitors, as these businesses should be able to make a decent profit as long as overhead costs are controlled (overhead refers to rent, utilities, etc.).
- Gross margin 2010 = $4.457 million / $7.949 billion = 56.07%.
- Gross margin 2011 = $2.186 billion / $8.027 billion. = 27.23%.
- Gross margin 2012 = $3.090 billion / $9.196 billion = 33.60%.
- Gross margin 2013 TTM = $3.781 billion / $9.478 billion = 39.89%.
Over the past four years, RIG's gross margin has dropped. The ratio has decreased from 56.07% in 2010 to 39.89% in 2013 TTM.
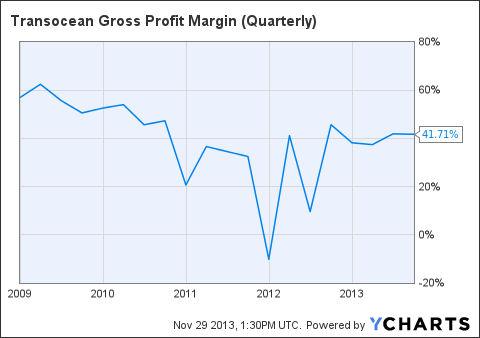
RIG Gross Profit Margin (Quarterly) data by YCharts
Asset Turnover
The formula for the asset turnover ratio evaluates how well a company is utilizing its assets to produce revenue. The numerator of the asset turnover ratio formula shows revenue found on a company's income statement and the denominator shows total assets, which are found on a company's balance sheet. Total assets should be averaged over the period of time that is being evaluated.
Revenue growth
- Revenue 2010 = $7.949 billion
- Revenue 2011 = $8.027 billion.
- Revenue 2012 = $9.196 billion.
- Revenue 2013 TTM = $9.478 billion
- Equals an increase of 19.28%.
Total Asset growth
- Total assets 2010 = $36.811 billion
- Total assets 2011 = $35.088 billion.
- Total assets 2012 = $34.255 billion.
- Total assets 2013 TTM = $32.601 billion.
- Equals an decrease of 11.44%.
Over the past three and a half years the revenue growth has increased by 19.28% while the assets have decreased by 11.44%. This is an indication that the company from a percentage point of view has been more efficient at generating revenue.
Based on the information above we can see that Transocean has produced mixed results from a fundamental point of view. Revenues over the past three and a half years, have increased by 19.28%, the ROA has increased to 5.00%. The company's revenues have increased more than the assets indicating the company is more efficient at generating revenue with its assets. A couple of notable blemishes on the company are: the gross margin is still down around 40% and the liabilities have increased while the assets have decreased. Based on the results above we can see that Transocean is producing mixed results.
Global Demand for Offshore Drilling
Over the next four years, it is estimated that global growth in the offshore E&P sector will increase at an 8% to 10% compound annual growth rate. With spending estimates in the range of $250 billion on the development of their offshore reserves, Brazil is leading the way. Second to Brazil in E&P spending is Norway, which is anticipating $220 billion to be spent on the development of the North Sea, Norwegian Sea, and the Barents Sea while estimates are that U.S. Gulf Of Mexico E&P spending is expected to be around $190 billion over the next four years. Just within these three regions, estimates total $760 billion in E&P spending over the next four years. From a global point of view this bodes well for Transocean.
Capacity Concerns in the Offshore Drilling Market
Even though the offshore drilling market is expected to grow significantly over the next four or five years, capacity is an issue of concern to investors. The issue of capacity is of concern to all companies in the offshore drilling industry. Investors of Transocean's competitors such as Seadrill inc. (SDRL), Diamond Offshore Drilling (DO) and Noble Corporation (NE) should keep an eye on the issue of capacity.
In an article published by Barrons they issued a statement about the capacity issue"
As the industry is expected to add 20 new rigs, or 16%, this year in 2013, 21 new rigs, or 14% in 2014 and 13 new rigs, or 7.8% in 2015, Sedita believes the new rigs are creating a "potential for short-term bubble." Sedita writes:
We believe there could be potential near-term excess capacity for ultradeepwater rigs in 2014 given a substantial number of newbuild rigs entering the market in a short span of time, as well as a bit sluggish demand in some regions (Brazil, West Africa). Long-term we believe demand is strong and the market will absorb the rigs over time. In the near-term we believe all of the ultradeepwater newbuilds will find contracts; however, dayrates will likely remain flat over the coming years and we see no rate upside. The risk to utilization and dayrates is in the lower-specification mid-water and deepwater markets. We believe over the near-term that some of these lower specification rigs could see idle time between contracts and a bit softer dayrates.
As the charts below indicates the capacity issue has been reflected in the companies stock prices. As you can see the sector has underperformed the S&P significantly.
As the offshore drilling market continues to expand and the market absorbs the incoming rigs this should increase day-rates and utilization rates in the future. As these rates increase so should the companies margins thus increase shareholder value.
Analysts' Estimates
Analysts at MSN Money are estimating that Transocean outpaces the industry average. They estimate that Transocean EPS will growth rate will be 19.10% while the industry growth rate is expected to be 13.20%.
Analysts are also estimated an EPS for FY 2013 at $4.19 while growth is expected to continue into 2014 as EPS estimates increase to $5.62.
Valuation
If we use the MSN money estimation of 19.10% growth in EPS year over year for the couple years this will form a very attractive PEG ratio and an excellent entry point for the stock.
Current PE Ratio = 11.32 (MSN)
11.32 / 19.10 = 0.59
PEG Ratio = 0.59
A current PEG ratio of 0.59 based on an EPS average growth rate over the next couple of years indicates that the stock is currently at undervalued.
Conclusion
As stated in my article: "Transocean: Not Undervalued For Long", As opportunities arise in the Deepwater, Ultra-Deepwater and harsh environment drilling over the next couple of years, Transocean will look to capitalize on them. Even in the face of over-capacity, Transocean is still posting strong fundamentals, and is poised to capitalize on future growth in the industry. Based on the above PEG ratio, I still believe that Transocean is still significantly undervalued.
Disclosure: I have no positions in any stocks mentioned, and no plans to initiate any positions within the next 72 hours. I wrote this article myself, and it expresses my own opinions. I am not receiving compensation for it (other than from Seeking Alpha). I have no business relationship with any company whose stock is mentioned in this article. (More...)
This entry passed through the Full-Text RSS service — if this is your content and you're reading it on someone else's site, please read the FAQ at fivefilters.org/content-only/faq.php#publishers.
from SeekingAlpha.com: Home Page http://seekingalpha.com/article/1869401-transocean-undervalued-with-growth-ahead-despite-capacity-concerns?source=feed
Aucun commentaire:
Enregistrer un commentaire