As stock traders take a break for Thanksgiving, all the major averages have hit new highs after breaking through psychological resistance levels, including the S&P 500 at 1800, Dow Jones Industrials at 16,000, and NASDAQ at 4000. Tech stocks were the big leaders on Wednesday after a strong earnings report from Hewlett-Packard (HPQ). The iShares US Technology ETF (IYW) finished up over +1% while the broad S&P 500 was only up +0.25%. Also, petroleum refiners had a strong day led by Marathon Petroleum (MPC), which is in our Baker's Dozen annual portfolio, after the firm agreed to partner with Enbridge on the new Sandpiper pipeline, which carries crude oil out of North Dakota's Bakken field.
Although Wall Street has been optimistic, as evidenced by the continual new highs and low volatility, consumer sentiment and general economic optimism is still low -- these are definitely not the roaring 90's from the standpoint of Main Street. For example, the AAII suggests that only 34% of surveyed investors are bullish, which is down from 49% just a month ago. But this is usually bullish from a contrarian perspective.
There is still abundant liquidity to continue fueling the engine of the bull train, and now we can add the historically bullish seasonality, bolstered by the wealth effect of rising stocks and real estate. Europe and China are holding up nicely, and even Iran is offering up at least a temporary respite for investors. Total short interest on S&P 500 stocks is near its highest levels of the year, which is bullish in that it can ignite frantic short-covering. The only possible stumbling block I see in the near term from a macro standpoint is the postponed US budget battle and debt ceiling.
Importantly, there appears to be no Fed tapering anywhere on the horizon, although I think they are keeping the threat alive in their discussions just to quell "irrational exuberance" in the equity markets. In fact, we might not see any tapering before 2015, and the Fed Funds rate could remain near zero for even longer.
Although corporate earnings are showing gradual improvement, doves on the FOMC remain unconvinced. As a result, the promise of persistently low interest rates gives validity to rising P/E multiples in stocks. Nevertheless, you constantly hear commentary about the imminent rise in longer-term interest rates and how investors should position themselves.
On this subject, our models that identify those stocks that historically tend to perform better or worse when various macro-variables are trending either up or down. Those variables include oil, copper, USD, Aussie dollar, euro, inflation, 10-year US Treasuries, and VIX. Because of the fear of rising rates, First Trust recently rolled out a unit investment trust containing 50 stocks identified by our team that tend to outperform the broader indexes when rates rise and Treasury prices fall. The primary sectors represented are Financial stocks, which can prosper from wider credit spreads, and Technology stocks, which tend to have lower debt ratios.
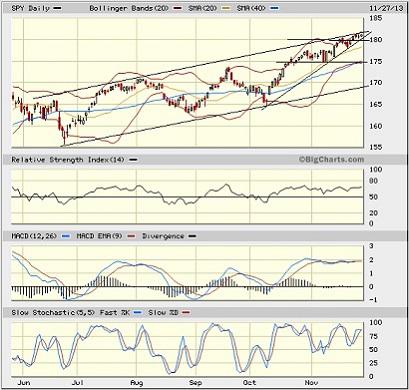
The SPY chart: The SPDR S&P 500 Trust (SPY) closed Wednesday at 181.12, which is yet another new closing high. Of course, "the trend is your friend." However, I am seeing a number of concerning things creeping into the chart. Although the 20-day simple moving average has been a reliable support level, price is getting quite extended above the longer term SMAs like the 50-day and 100-day. Also, there may be a bearish rising wedge forming, as I have drawn on the chart, as higher highs and higher lows are coming about on decreasing volume. The top of the wedge corresponds to the long-standing bullish ascending channel, and price has been having no luck breaking through the top of the channel. Finally, oscillators like RSI and MACD have been above the neutral line for quite some time, and in fact MACD has virtually flat-lined in overbought territory this entire month of November.

Nevertheless, as price rapidly approaches the apex of the wedge, if it does fail bearishly to the downside, I would expect 175 and the 50-day SMA to offer strong support.
The CBOE Market Volatility Index (VIX), a.k.a. "fear gauge," closed Wednesday at 12.98, which is up notably from its Friday close. However, it is still near its historic lows, so investors remain complacent, overall.
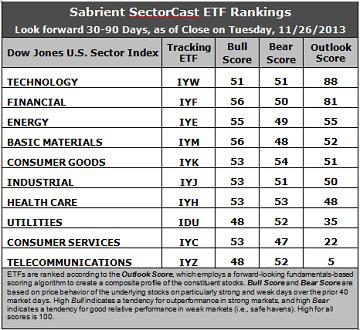
Latest rankings: The table ranks each of the ten U.S. business sector iShares ETFs by our Outlook Score, which employs a forward-looking, fundamentals-based, quantitative algorithm to create a bottom-up composite profile of the constituent stocks within the ETF. The multi-factor model considers forward valuation, historical earnings trends, earnings growth prospects, the dynamics of Wall Street analysts' consensus estimates, accounting practices and earnings quality, and various return ratios. In addition, the table also shows our Bull Score and Bear Score for each ETF.
High Bull score indicates that stocks within the ETF have tended recently toward relative outperformance during particularly strong market periods, while a high Bear score indicates that stocks within the ETF have tended to hold up relatively well during particularly weak market periods. Bull and Bear are backward-looking indicators of recent sentiment trend.
As a group, these three scores can be quite helpful for positioning a portfolio for a given set of anticipated market conditions.

Observations:
1. Technology regains the top spot this week with an Outlook score of 88. IYW still displays one of the lowest forward P/Es, a solid long-term forward growth rate, and the best return ratios, and this week sentiment among Wall Street analysts and insiders (i.e., open-market buying) improved significantly. Financial (IYF) takes second place with an 81. It displays one of the lowest forward P/Es and excellent sentiment among both Wall Street analysts and company insiders. IYW and IYF sit well above the rest of the field, and these two have been enjoying the most sell-side upgrades.
2. In third place with a score of 55 is Energy (IYE), followed by Basic Materials (IYM), as Wall Street sentiment has improved dramatically. However, five sectors are all pretty much bunched together in the middle -- Energy, Materials, Consumer Goods (IYK), Industrial (IYJ), and Healthcare (IYH). Notably, IYM rose 18 points while IYK fell 16 points.
3. Telecom (IYZ) is in the cellar yet again with an Outlook score of 5. IYZ scores among the lowest in all factors in the model, including the highest forward P/E, lowest return ratios, a low projected long-term growth rate, and poor sentiment among insiders and Wall Street analysts. Consumer Services (IYC) remains in the bottom two with an Outlook score of 22.
4. This week's fundamentals-based rankings strengthened their bullish bias, with Technology and Financial at the top, and with Energy, Materials, and Industrial scoring at 50 or better.
5. Looking at the Bull scores, Basic Materials and Financial have been the leaders on particularly strong market days, scoring 56. Technology is rising in its Bull score, which should be encouraging for bulls, and in fact 8 of the 10 sectors are scoring above 50. At the bottom are defensive sectors Utilities (IDU) and Telecom with a score of 48. The top-bottom spread is only 8 points, which still indicates high sector correlations (all-boats-lifted buying) on particularly strong market days.
6. Looking at the Bear scores, Consumer Goods holds the top spot as favorite "safe haven" on weak market days, scoring 54, while Consumer Services displays the lowest Bear score of 47. Notably, 7 of the 10 sectors are scoring above 50. The top-bottom spread is only 7 points, which indicates low sector correlations (across-the-board selling) on particularly weak market days.
7. Overall, IYW shows the best all-weather combination of Outlook/Bull/Bear scores. Adding up the three scores gives a total of 190. IYZ is the by far the worst at 105. Looking at just the Bull/Bear combination, IYK displays the highest score of 107 this week, followed closely by IYF and IYH. Their scores indicate good relative performance in extreme market conditions (whether bullish or bearish), while IYZ, IYC, and IDU are the lowest at 100, which indicates investor avoidance (relatively speaking) during extreme conditions (particularly bullish conditions, in this case).
These Outlook scores represent the view once again that Technology and Financial sectors are still relatively undervalued, while Telecom and Consumer Services may be relatively overvalued based on our 1-3 month forward look.
Some top-ranked stocks that are components of IYW and IYF include Google (GOOG), Western Digital (WDC), BlackRock (BLK), and Allied World Assurance (AWH).
By the way, our "Baker's Dozen" annual portfolio is now up +45.4% since inception on January 11, doubling the S&P 500 return of +22.8% over the same timeframe. Moreover, all 13 stocks are comfortably positive and 12 are up by double digits, led by Jazz Pharmaceuticals (JAZZ), Genworth Financial (GNW), Alaska Air Group (ALK), and NXP Semiconductor (NXPI). There have been no offsetting meltdowns in the portfolio, and we believe our proprietary Earnings Quality Rank (EQR) is a primary reason. EQR is a pure accounting-based risk assessment signal based on the forensic accounting expertise of our subsidiary, Gradient Analytics.
Note that the next Baker's Dozen annual portfolio for 2014 will launch on January 13.
Disclosure: I have no positions in any stocks mentioned, and no plans to initiate any positions within the next 72 hours. I wrote this article myself, and it expresses my own opinions. I am not receiving compensation for it. I have no business relationship with any company whose stock is mentioned in this article. (More...)
This entry passed through the Full-Text RSS service — if this is your content and you're reading it on someone else's site, please read the FAQ at fivefilters.org/content-only/faq.php#publishers.
from SeekingAlpha.com: Home Page http://seekingalpha.com/article/1868831-is-there-still-enough-fuel-in-the-bulls-tank?source=feed
Aucun commentaire:
Enregistrer un commentaire