In order to create a dividend stock portfolio that can outperform the market by a big margin, I have used the following screen. It is based on an attempt to search for highly profitable companies that pay rich dividends and that have raised their payouts at a high rate for the last year and the last three years. Furthermore, in order to decrease the maximum expected drawdown to a lower level than that of the benchmark I had to be satisfied with a bit lower return, but still much better than the benchmark.
The screen's method that I use to build this portfolio requires all stocks to comply with all following demands:
- The stock does not trade over-the-counter (OTC).
- Market cap is greater than $100 million.
- Price is greater than 1.00
- Dividend yield is greater than 2.0%.
- The payout ratio is less than 50%.
- The annual rate of dividend growth over the past year is greater than 10%.
- The annual rate of dividend growth over the past three years is greater than 10%.
- Total debt to equity is less than 0.50.
- The twenty stocks with the lowest payout ratio among all the stocks that complied with the first eight demands.
I used the Portfolio123's powerful screener to perform the search and to run back-tests. Nonetheless, the screening method should only serve as a basis for further research. All the data for this article were taken from Yahoo Finance, Portfolio123 and finviz.com.
After running this screen on November 27, 2013, before the market open, I discovered the following twenty stocks:
(click to enlarge)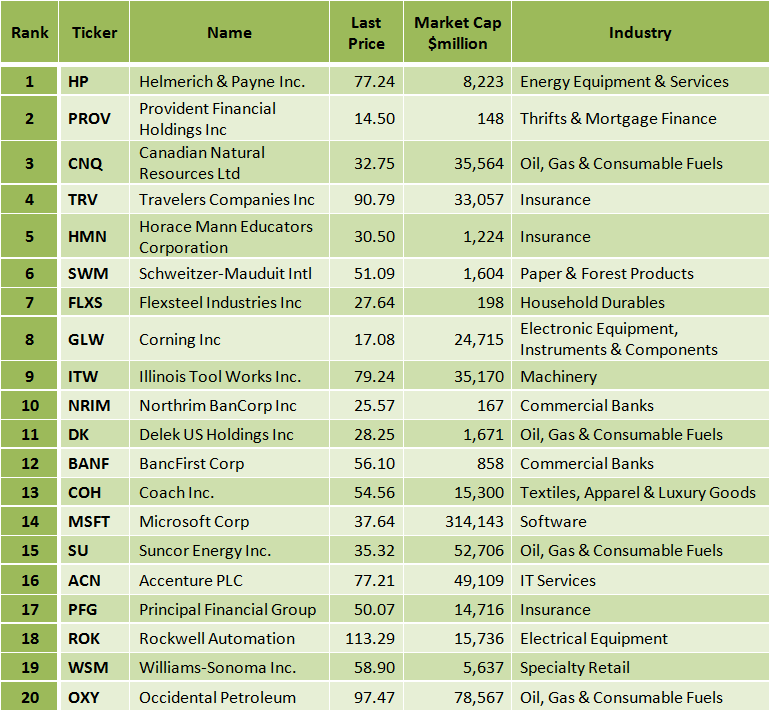
The table below presents the dividend yield, the payout ratio, the trailing P/E and the total debt to equity for the twenty companies.
(click to enlarge)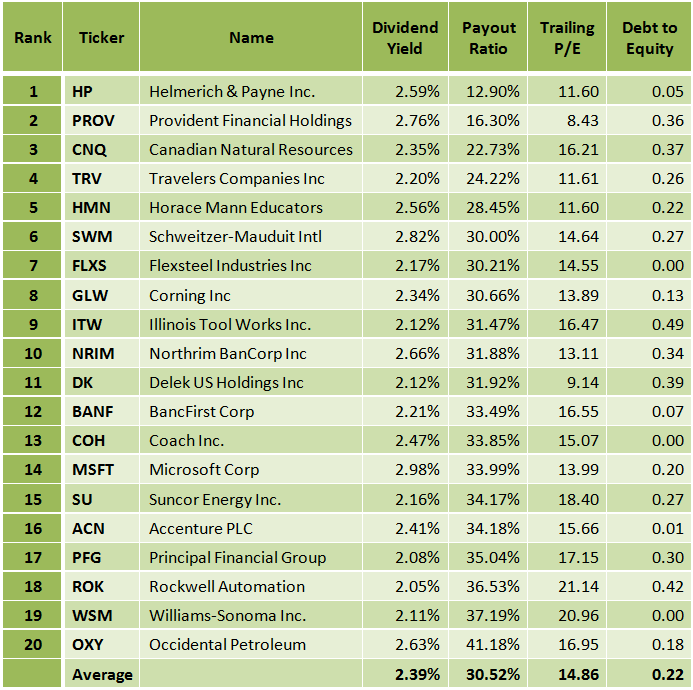
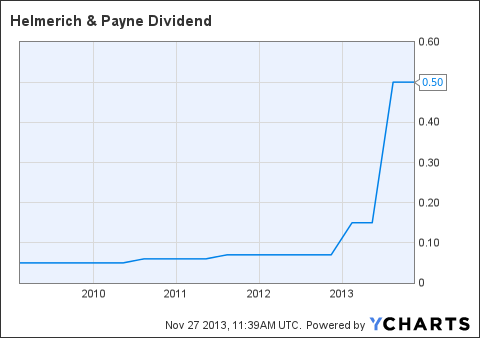
Helmerich & Payne Inc. (HP)
Helmerich & Payne, Inc. engages in the contract drilling of oil and gas wells.
See my article from November 15, 2013.
(click to enlarge)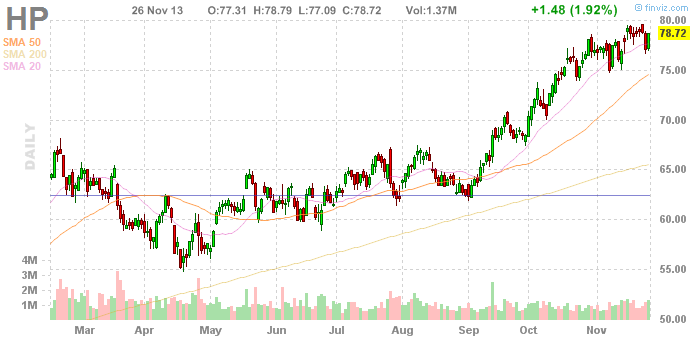
Chart: finviz.com
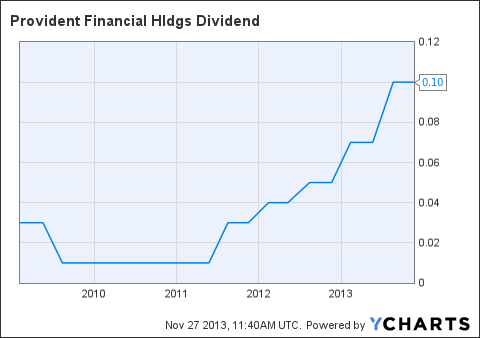
Provident Financial Holdings, Inc. (PROV)
Provident Financial Holdings, Inc. operates as the holding company for Provident Savings Bank, F.S.B. that provides community banking and mortgage banking services to consumers and small to mid-sized businesses in the Inland Empire region of Southern California.
See my article from November 15, 2013.
(click to enlarge)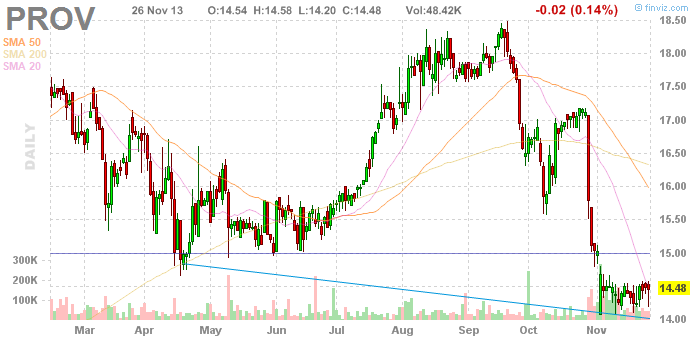
Chart: finviz.com
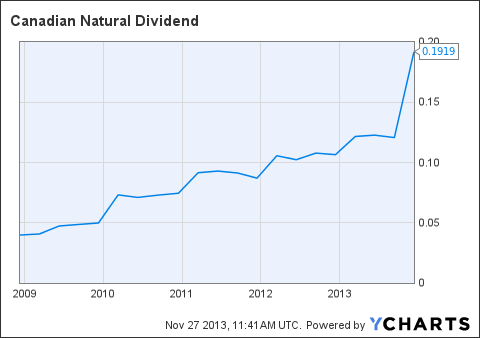
Canadian Natural Resources Limited (CNQ)
Canadian Natural Resources Limited engages in the exploration, development, production and marketing of crude oil, natural gas liquids, and natural gas.
See my article from November 20, 2013.
(click to enlarge)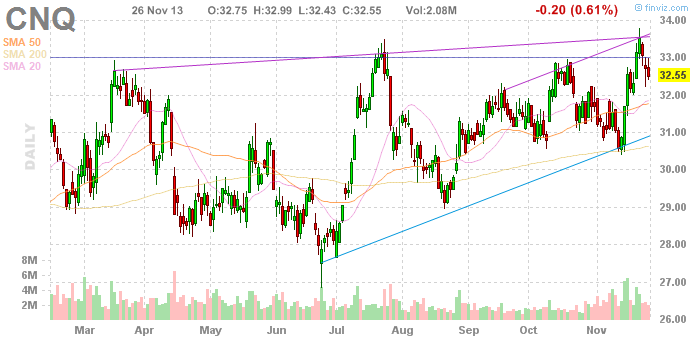
Chart: finviz.com
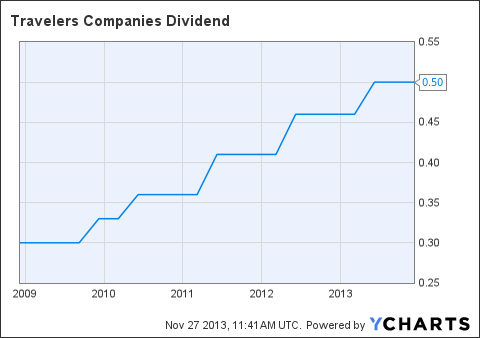
Travelers Companies Inc. (TRV)
The Travelers Companies, Inc., through its subsidiaries, provides various commercial and personal property and casualty insurance products and services to businesses, government units, associations, and individuals primarily in the United States.
See my article from November 26, 2013.
(click to enlarge)
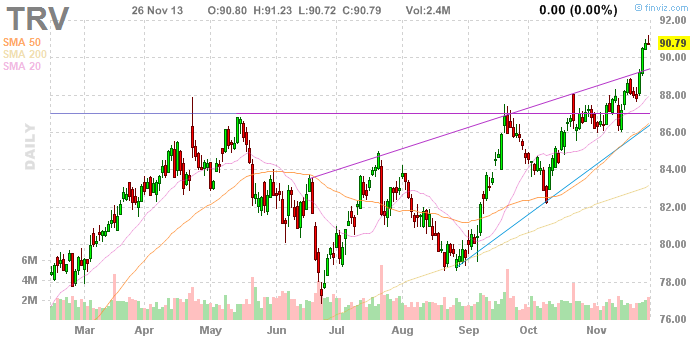
Chart: finviz.com
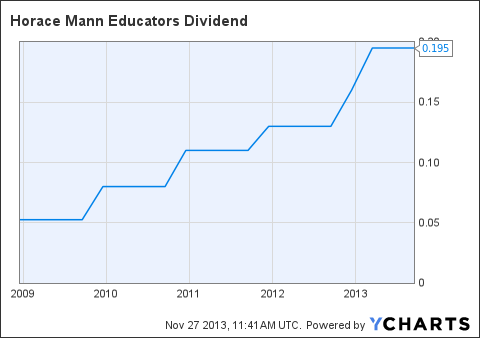
Horace Mann Educators Corp. (HMN)
Horace Mann Educators Corporation, through its subsidiaries, operates as a multi-line insurance company in the United States.
See my article from November 13, 2013.
(click to enlarge)
Chart: finviz.com
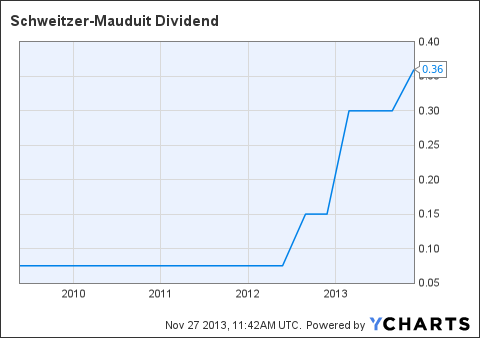
Schweitzer-Mauduit International Inc. (SWM)
Schweitzer-Mauduit International, Inc. manufactures and sells paper and reconstituted tobacco products to the tobacco industry; and specialized paper products for use in various applications.
See my article from November 13, 2013.
(click to enlarge)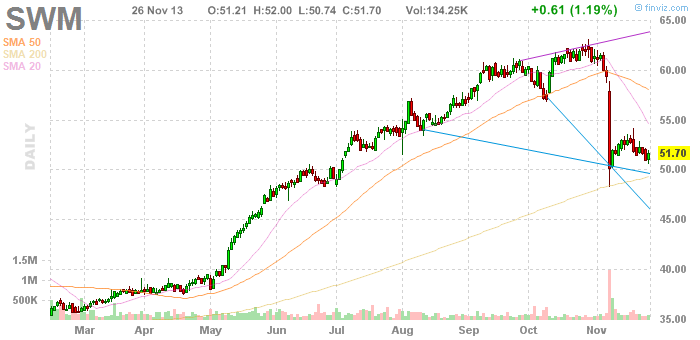
Chart: finviz.com
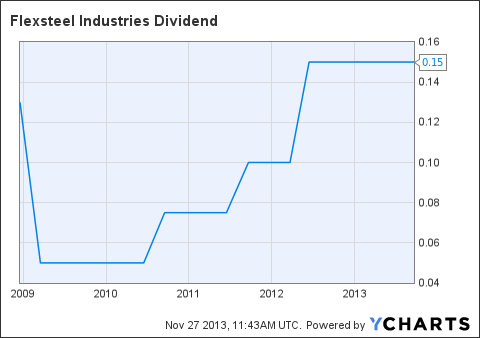
Flexsteel Industries Inc. (FLXS)
Flexsteel Industries, Inc. manufactures, imports, and markets residential and commercial upholstered and wood furniture products in the United States.
(click to enlarge)
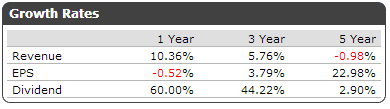
Flexsteel Industries has no debt at all, and it has a low trailing P/E of 14.55. The price-to-sales ratio is very low at 0.49, and the price to book value is at 1.27. The forward annual dividend yield is at 2.17%, and the payout ratio is only 30.2%. The annual rate of dividend growth over the past three years was very high at 38.57%, and over the past five years was at 2.90%.
The FLXS stock price is 0.29% above its 20-day simple moving average, 5.86% above its 50-day simple moving average and 16.18% above its 200-day simple moving average. That indicates a short-term, a mid-term and a long-term uptrend.
Flexsteel Industries has recorded revenue, EPS and dividend growth, during the last three years, as shown in the table below.
On October 16, Flexsteel Industries reported its first-quarter fiscal 2014 financial results. The company reported net sales of $104.3 million for the quarter ended September 30, 2013, an increase of 14% from the prior year quarter. Residential net sales increased approximately 16% to $84.0 million in the current quarter, primarily due to increased sales of upholstered and ready to assemble products. Commercial net sales increased approximately $1.4 million or 8% to $20.3 million. Net income for the first fiscal quarter ended September 30, 2013 was $3.8 million or $0.51 per share compared to $2.9 million or $0.40 per share for the prior year quarter. In the report, the company gave the following outlook.
Outlook
The Company believes that top line growth will continue through the end of fiscal year 2014. Residential growth is expected to continue with existing customers and products, and through expanding our product portfolio and customer base. The Company expects this growth to be led by increased demand for upholstered and ready to assemble products. The Company anticipates sales of commercial products to moderately increase for the remainder of the fiscal year. The Company is confident in its ability to take advantage of market opportunities.
Flexsteel Industries has recorded revenue, EPS and dividend growth, and considering its latest quarter financial result, which was the strongest in the company's first quarter history, FLXS stock can move higher. Furthermore, the rich growing dividend represents a nice income.
Risks to the expected capital gain and to the dividend payment include; a downturn in the U.S. economy and a lower demand to the company's products.
(click to enlarge)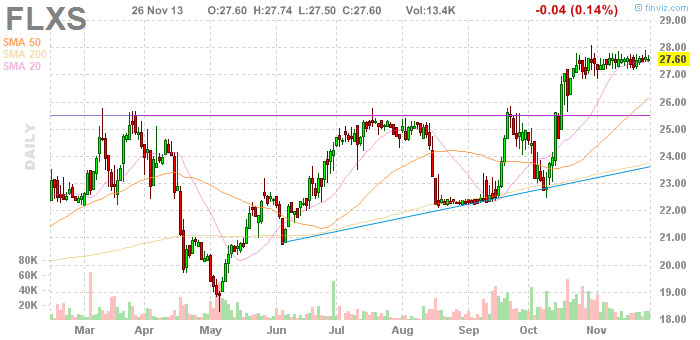
Chart: finviz.com
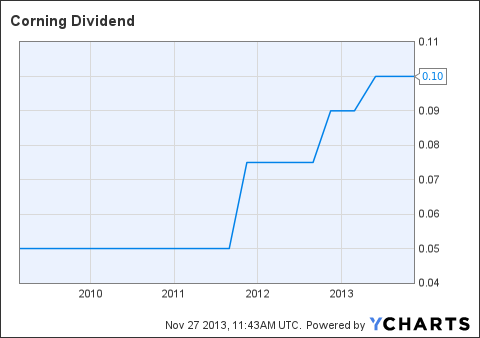
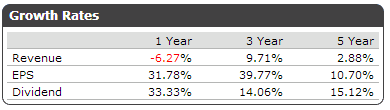
Corning Inc. (GLW)
Corning Incorporated produces and sells specialty glasses, ceramics, and related materials worldwide.
See my article from November 14, 2013.
(click to enlarge)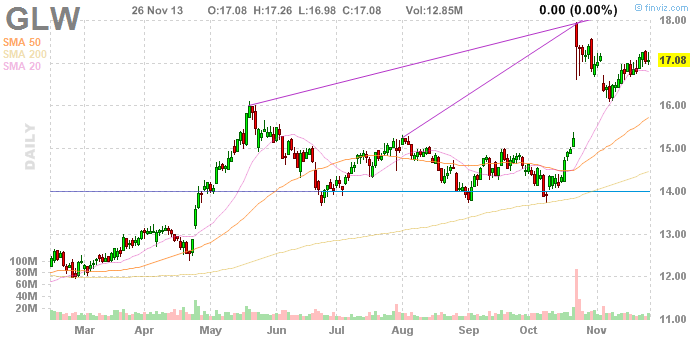
Chart: finviz.com
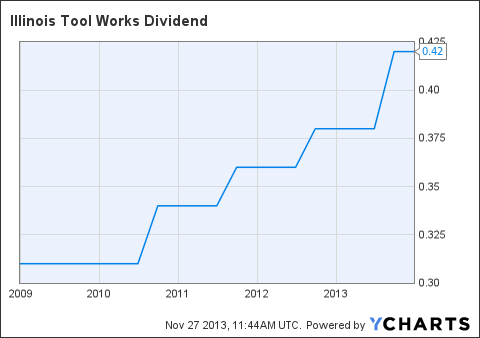
Illinois Tool Works Inc. (ITW)
Illinois Tool Works Inc. manufactures and sells a range of industrial products and equipment worldwide.
Illinois Tool Works has a low debt (total debt to equity is 0.49), and it has a trailing P/E of 16.47 and a forward P/E of 17.78. The PEG ratio is quite low at 1.11, and the average annual earnings growth estimates for the next five years is high at 14.75%. The forward annual dividend yield is at 2.12%, and the payout ratio is only 31.5%. The annual rate of dividend growth over the past five years was at 6.29%.
The ITW stock price is 0.22% above its 20-day simple moving average, 2.24% above its 50-day simple moving average and 13.64% above its 200-day simple moving average. That indicates a short-term, a mid-term and a long-term uptrend.
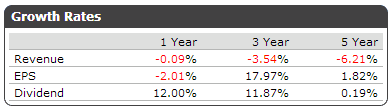
Illinois Tool Works has recorded strong revenue, EPS and dividend growth, during the last three years and the last five years, as shown in the table below.
Most of Illinois Tool Works' margin and return on capital parameters have been better than its industry median, sector median and the S&P 500 median, as shown in the tables below.
(click to enlarge)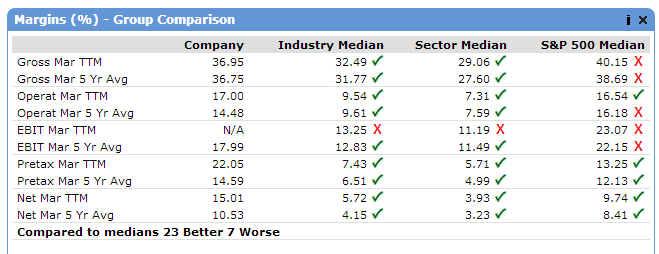
(click to enlarge)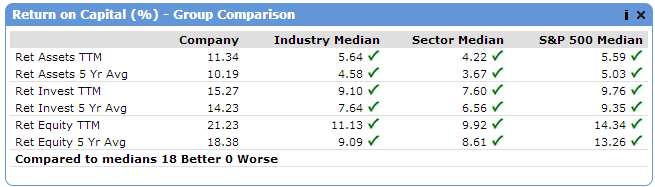
Source: Portfolio123
On October 21, Illinois Tool Works reported its third-quarter financial results.
Third-Quarter Highlights
- Third quarter diluted EPS from continuing operations of $0.90 exceeds Company forecast midpoint of $0.88
- Strong operating margins of 19.0 percent improve 110 basis points versus year-ago period; Enterprise initiatives add 80 basis points to operating margin
- Company raises 2013 full-year EPS forecast midpoint to $3.60 from $3.58
Illinois Tool Works has recorded revenue, EPS and dividend growth, and considering its strong earnings growth prospects, and the fact that the stock is in an uptrend, ITW stock can move higher. Furthermore, the rich growing dividend represents a nice income.
(click to enlarge)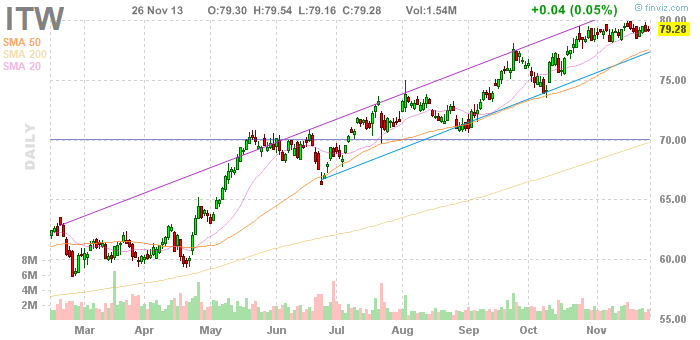
Chart: finviz.com
Northrim Bancorp Inc. (NRIM)
Northrim BanCorp, Inc. operates as the bank holding company for Northrim Bank that provides commercial banking products and services to businesses, professionals, and individuals primarily in Alaska.
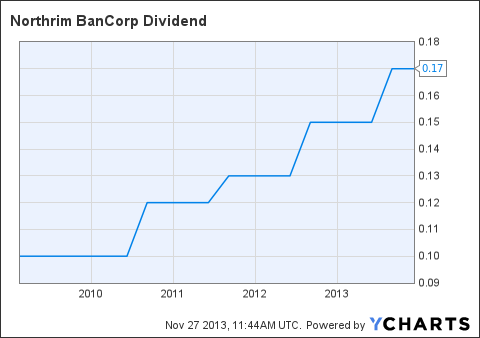
Northrim BanCorp has a low debt (total debt to equity is only 0.34), and it has a very low trailing P/E of 13.11 and a very low forward P/E of 13.29. The price to free cash flow is very low at 4.69, and the price to cash is also very low at 1.91. The forward annual dividend yield is at 2.66%, and the payout ratio is only 31.9%. The annual rate of dividend growth over the past three years was at 13.78%.
The NRIM stock price is 1.90% above its 20-day simple moving average, 5.34% above its 50-day simple moving average and 10.46% above its 200-day simple moving average. That indicates a short-term, a mid-term and a long-term uptrend.
Northrim BanCorp has recorded EPS and dividend growth, during the last three years, as shown in the table below.
Most of Northrim BanCorp'S margin, return on capital and stock valuation parameters have been better than its industry median and its sector median, as shown in the tables below.
(click to enlarge)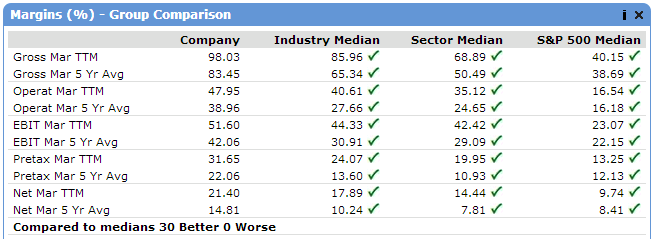
(click to enlarge)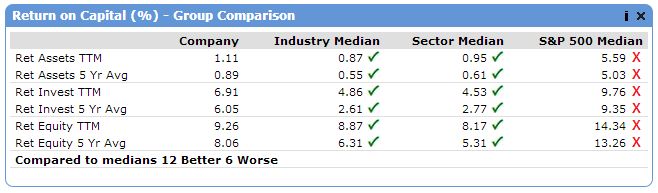
(click to enlarge)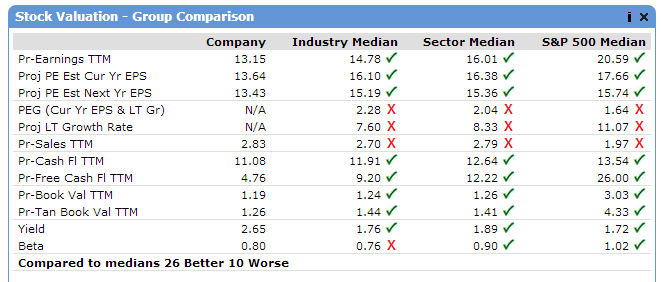
On October 22, Northrim BanCorp reported its third-quarter financial results, which beat EPS expectations by $0.10. The company reported net profits of $3.5 million, or $0.53 per diluted share in the third quarter of 2013, unchanged from the preceding quarter and down from $4.1 million, or $0.62 per diluted share in the third quarter of 2012. An increase in portfolio loans led to an increase in net interest income which partially offset lower contributions from Northrim's mortgage affiliate in the third quarter and first nine months of 2013. In the first nine months of 2013, Northrim earned $9.6 million, or $1.46 per diluted share, compared to $9.8 million, or $1.49 per diluted share in the first nine months of 2012.
Northrim BanCorp has recorded EPS and dividend growth, and considering its cheap valuation metrics and the fact that the stock is in an uptrend, NRIM stock can move higher. Furthermore, the rich growing dividend represents a nice income.
(click to enlarge)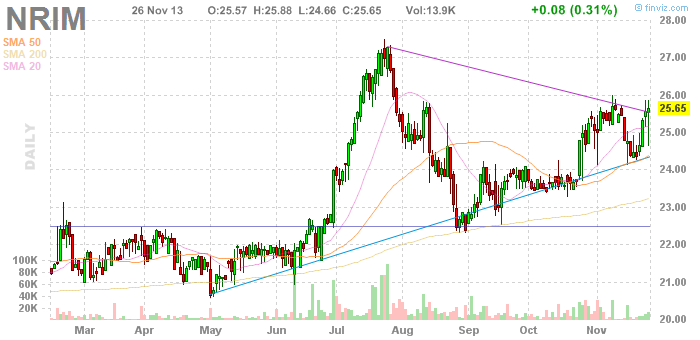
Chart: finviz.com
Back-testing
In order to find out how such a screening formula would have performed during the last year, last 5 years and last 15 years, I ran the back-tests, which are available by the Portfolio123's screener.
The back-test takes into account running the screen every four weeks and replacing the stocks that no longer comply with the screening requirement with other stocks that comply with the requirement. The theoretical return is calculated in comparison to the benchmark (S&P 500), considering 0.25% slippage for each trade and 1.5% annual carry cost (broker cost). The back-tests results are shown in the charts and the tables below.
Since some readers could not get the same results that I got in some of my previous posts, I am giving, in the charts below, the Portfolio123 exact codes which I used for building this screen and the back-tests. The number of stocks left after each demand can also be seen in the chart. I am also giving a table which readers can use to copy and paste codes directly into the Portfolio123's screener.
(click to enlarge)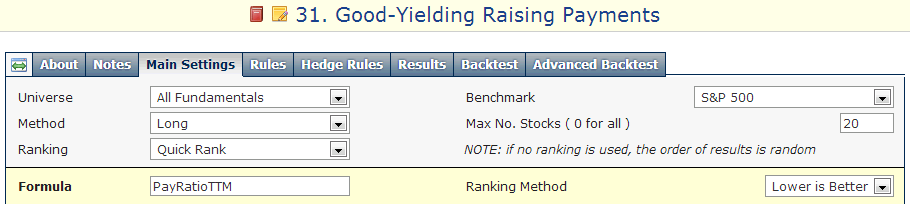
(click to enlarge)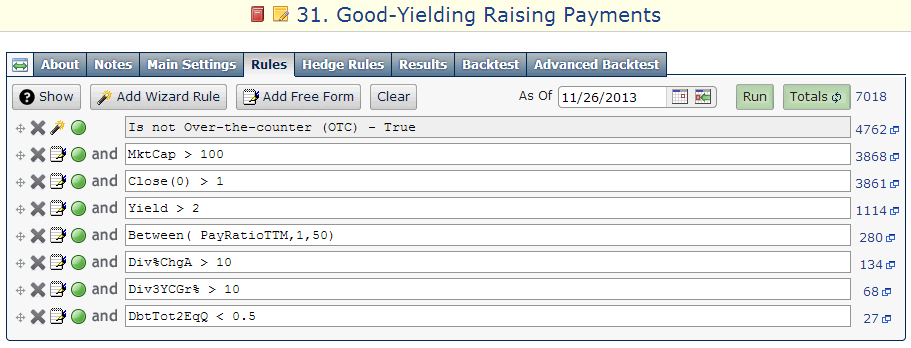
Universe(NOOTC)=TRUE |
MktCap > 100 |
Close(0)> 1 |
Yield > 2 |
Between(PayRatioTTM,1,50) |
Div%ChgA > 10 |
Div3YCGr% > 10 |
DbtTot2EqQ < 0.5 |
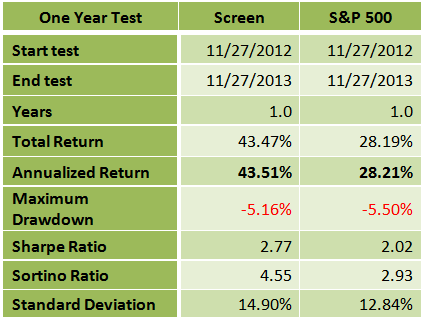
One year back-test
(click to enlarge)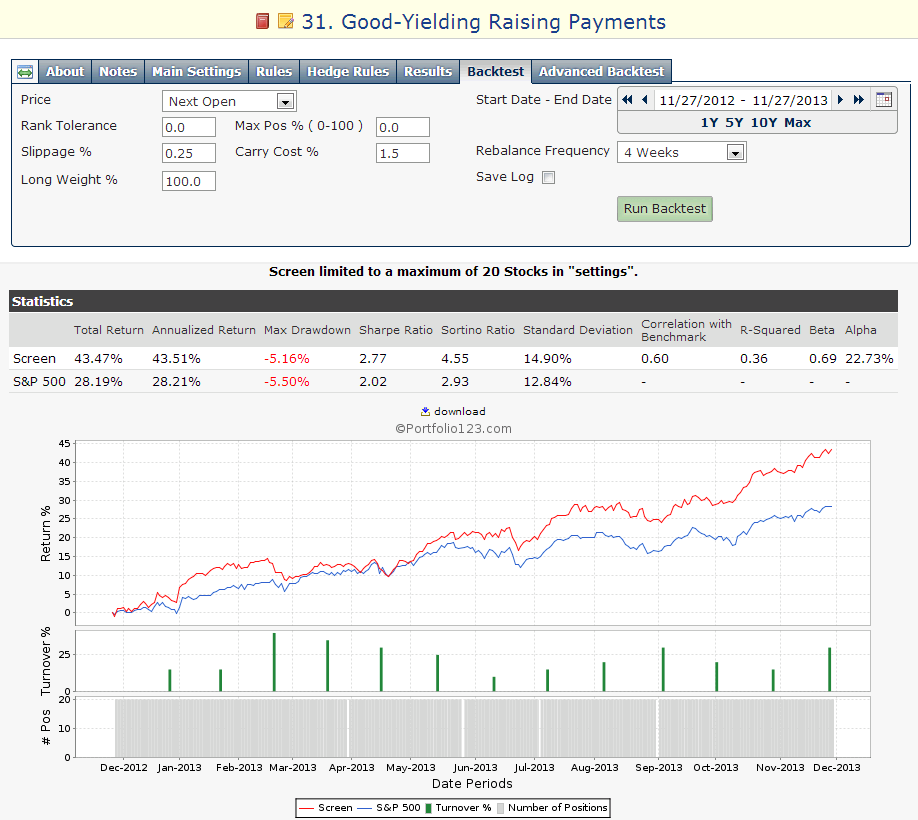
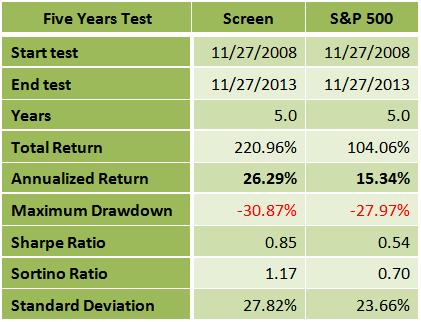
Five years back-test
(click to enlarge)
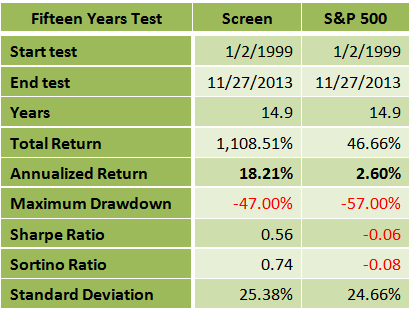
Fifteen years back-test
(click to enlarge)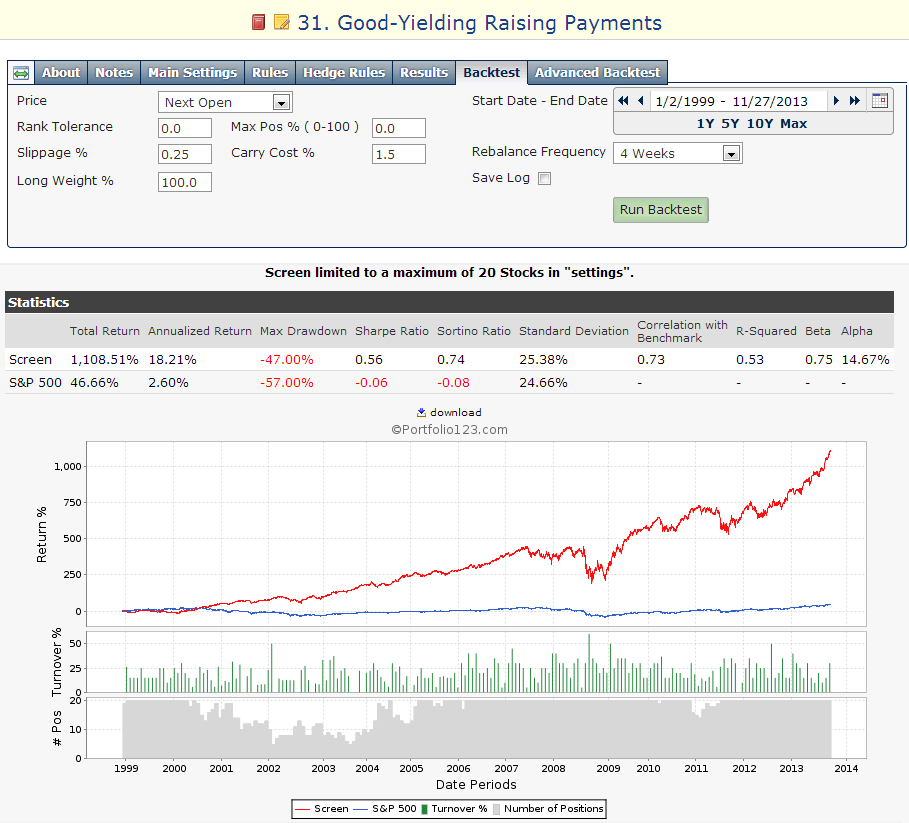
Summary
The low risk dividend screen has given much better returns during the last year, the last five years and the last fifteen years than the S&P 500 benchmark. The Sharpe ratio, which measures the ratio of reward to risk, was also much better in all the three tests. Furthermore, the maximum drawdown, which normally is much bigger in a small portfolio than in the benchmark, was much smaller in the one year and the fifteen years tests.
One-year return of the screen was very high at 43.51%, while the return of the S&P 500 index during the same period was at 28.21%.
The difference between the low risk dividend screen to the benchmark was even more noticeable in the 15 years back-test. The 15-year average annual return of the screen was at 18.21%, while the average annual return of the S&P 500 index during the same period was only 2.60%. The maximum drawdown of the screen was at 47%, while that of the S&P 500 was at 57%.
Although this screening system has given superior results, I recommend readers use this list of stocks as a basis for further research.
Disclosure: I am long SWM. I wrote this article myself, and it expresses my own opinions. I am not receiving compensation for it (other than from Seeking Alpha). I have no business relationship with any company whose stock is mentioned in this article. (More...)
This entry passed through the Full-Text RSS service — if this is your content and you're reading it on someone else's site, please read the FAQ at fivefilters.org/content-only/faq.php#publishers.
from SeekingAlpha.com: Home Page http://seekingalpha.com/article/1868401-a-good-yielding-lower-risk-dividend-portfolio-that-has-outperformed-the-market?source=feed
Aucun commentaire:
Enregistrer un commentaire