Regardless of what your opinion may be in regards to the Affordable Care Act ("ObamaCare"), it is now the law of the land. As such, we all have to deal with it. Recently I purchased two stocks for my clients, which I believe will benefit substantially from ObamaCare, once it becomes fully implemented. They are McKesson Corp. (MCK) and AmerisourceBergen (ABC).
Both companies are key players in the drug wholesale industry. Eventually with tens of millions of new patients going on the health care rolls, this means that by sheer volume alone, a great increase in generic drug use would be predicted to occur, resulting in significant increases in revenue for both companies.
Accordingly, the following is a free cash flow analysis of each company, to see if the financials are as powerful as the future prospects are for these two companies.
This analysis will use the following six free cash flow ratios:
- CapFlow
- FROIC
- Price to Mycroft Free Cash Flow
- Mycroft/Michaelis Growth Rate
- Free Cash Flow Payout Ratio
- Free Cash Flow Reinvestment Rate
Those new to this analysis can find an introduction by going here that will explain in detail how each of these ratios is calculated. When used together, these unique ratios generate a quantitative picture of a company's underlying fundamentals, taking into account both strengths and weaknesses.
(click to enlarge)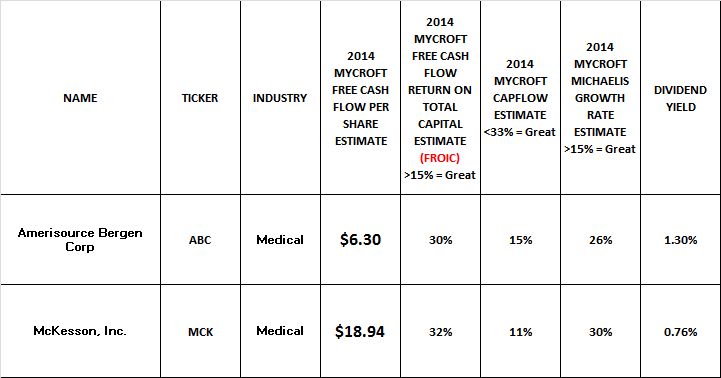
The "2014 Mycroft Free Cash Flow per share" estimate in the table above was generated by taking the trailing twelve months (TTM) free cash flow result for both companies and then adding my Mycroft Michaelis Growth Rate into the equation in order to generate forward looking estimates for 2014. That growth rate is generated by using my FROIC ratio (Free Cash Flow Return on Invested Capital). Basically FROIC tells us how efficient operations are as it identifies how much free cash flow is generated for every $1 of total capital employed.
AmerisourceBergen has a FROIC of 30%, which means that for every $100 of invested capital, they generate $30 in free cash flow.
McKesson has a FROIC of 32%, which means that for every $100 of invested capital, they generate $32 in free cash flow.
Now my Mycroft/Michaelis Ratio takes that FROIC result for each company and multiplies it by the firm's free cash flow reinvestment rate. The reinvestment rate that I use is a free cash flow reinvestment rate instead of the standard one used by analysts that simply uses net income. It is calculated as follows:
Free Cash Flow Reinvestment Rate = 100% - (Free Cash Flow Payout Ratio).
Or;
Free Cash Flow Reinvestment Rate = 100% - (Total Dividend/Total Free Cash Flow).
By replacing net income in the payout and reinvestment ratios with free cash flow, I am thus able to make my analysis more precise by incorporating capital spending (Cap Ex) into the equation.
Therefore from this we can determine that AmerisourceBergen has a reinvestment rate of 83% and went on to use 17% of its free cash flow to pay out its dividend. Thus by taking 30% (FROIC) x 83% = 24.9% (rounded off at 25%). From there we add the dividend yield of 1.3% (rounded off at 1%) and we have a Mycroft/Michaelis growth rate of 25% + 1% = 26%.
McKesson has a reinvestment rate of 93% and went on to use 7% of its free cash flow to pay out its dividend. Thus by taking 32% (FROIC) x 93% = 29.76%. From there we add the dividend yield of 0.60% and we have a Mycroft/Michaelis growth rate of 29.76% + 0.60% = 30.36% (rounded off at 30%).
AmerisourceBergen's Mycroft Free Cash Flow per share of $6.30 was generated by taking its TTM free cash flow per share and multiplying it by (100% + 26% or 1.26). Once we have our result, we then take its current market price of $69.72 and divide it by $6.30 and get a Price to Mycroft Free Cash Flow result of 11.06.
McKesson's Mycroft Free Cash Flow per share of $18.94 was generated by taking its TTM free cash flow per share and multiplying it by (100% + 30% or 1.30). Once we have our result, we then take its current market price of $161.50 and divide it by $18.94 and get a Price to Mycroft Free Cash Flow result of 8.52. I consider a Price to Mycroft Free Cash Flow per share result of less than 15 to be good for purchase, and anything under 7.5 to be excellent.
(click to enlarge)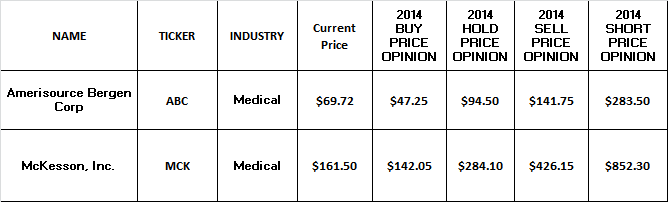
The higher you go above 15, the more overvalued a company becomes. I use a Price to Mycroft Free Cash Flow per share result of 22.5 as my sell price, and 45 as my short price.
An appropriately priced stock should trade around a Price to Mycroft Free Cash Flow per share result of 15. This benchmark result was determined by backtesting.
Buy (opinion) = A Price to Mycroft Free Cash Flow per share result of less than 7.5 is considered excellent (50% below the initial Hold level), and anything under 15 is attractive.
The result I give as my Buy opinion in the table above uses a Price to Mycroft Free Cash Flow per share result of 7.5.
Hold (opinion) = 15 to 22.5 (I use 15 in the table).
Sell (opinion) = 22.5 or higher (50% above the initial Hold level). (I use 22.5 in the table).
Short (opinion) = 45 or greater. The Price to Mycroft Free Cash Flow per share result of 45 was determined by going back to the peak of the market (in the year 2000) and averaging the Price to Free Cash Flow per share results for the key players at that time. (I use 45 in the table).
The CapFlow ratio result that you see in the first table above is an original ratio I created in order to tell me how much Capital Spending is used as a percentage of Cash Flow. A result of less than 33% is considered ideal and with AmerisourceBergen coming in at just 15%, means that 85% of the company's cash flow is actually free cash flow and can be used for such things as buying back stock. McKesson on the other hand has a CapFlow of 11%, which means that 89% of the company's cash flow is actually free cash flow.
Both companies have been strong growth plays over the last five years and here is the proof:
(click to enlarge)
In conclusion, as illustrated by the chart above, an investment made in 2009, in either of the two companies would have made you about 300% in profit. Both companies are generating an incredible amount of free cash flow and that is why each has a very low Price to Mycroft Free Cash Flow per share, thus making each a bargain. When you add in the great story of how each company is likely to benefit by ObamaCare and match that with strong fundamentals, I am happy to have purchased both for my client accounts.
Disclosure: I am long MCK, ABC. I wrote this article myself, and it expresses my own opinions. I am not receiving compensation for it (other than from Seeking Alpha). I have no business relationship with any company whose stock is mentioned in this article. (More...)
This entry passed through the Full-Text RSS service — if this is your content and you're reading it on someone else's site, please read the FAQ at fivefilters.org/content-only/faq.php#publishers.
Aucun commentaire:
Enregistrer un commentaire