As part of our process, we perform a rigorous discounted cash-flow methodology that dives into the true intrinsic worth of companies. In McDonald's (MCD) case, we think the firm is fairly valued at $84, just below where it is currently trading.
At Valuentum, we think a comprehensive analysis of a firm's discounted cash-flow valuation, relative valuation versus industry peers, as well as an assessment of technical and momentum indicators is the best way to identify the most attractive stocks at the best time to buy. This process culminates in what we call our Valuentum Buying Index (click here to download an in-depth presentation about our methodology), which ranks stocks on a scale from 1 to 10, with 10 being the best. Essentially, we're looking for firms that overlap investment methodologies, thereby revealing the greatest interest by investors (we like firms that fall in the center of the diagram below):
(click to enlarge)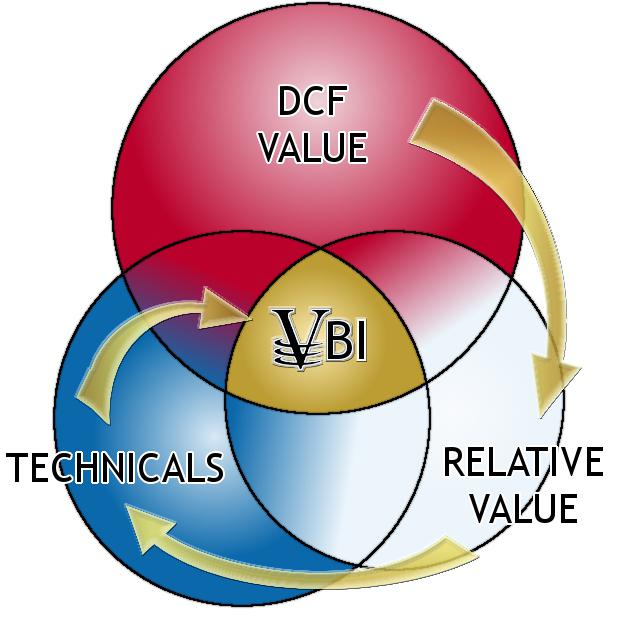
If a company is undervalued both on a DCF and on a relative valuation basis and is showing improvement in technical and momentum indicators, it scores high on our scale. McDonald's posts a VBI score of 6 on our scale, reflecting our 'fairly valued' DCF assessment of the firm and its neutral relative valuation versus peers. We compare McDonald's to peers Darden Restaurants (DRI), Starbucks (SBUX), and YUM! Brands (YUM).
Investment Considerations

Investment Highlights
• McDonald's business quality (an evaluation of our ValueCreation™ and ValueRisk™ ratings) ranks among the best of the firms in our coverage universe. The firm has been generating economic value for shareholders with relatively stable operating results for the past few years, a combination we view very positively.
• Unfortunately for McDonald's, we feel the company is not creating menu innovations at the pace it was just a few years ago. It will be hard for the company to pull another gem out of its hat to the same magnitude as McCafe (a huge success).
• McDonald's has an excellent combination of strong free cash flow generation and low financial leverage. We expect the firm's free cash flow margin to average about 18.5% in coming years. Total debt-to-EBITDA was 1.4 last year, while debt-to-book capitalization stood at 47.1%.
• McDonald's focus on market share and value has made it difficult for franchisees to achieve solid returns, making it plausible that these entrepreneurs will look to put their money to work elsewhere (or simply invest less in the company). Franchisee dissatisfaction could dissipate in the event that commodity costs ease, however.
Business Quality

Economic Profit Analysis
The best measure of a firm's ability to create value for shareholders is expressed by comparing its return on invested capital - ROIC - with its weighted average cost of capital - WACC. The gap or difference between ROIC and WACC is called the firm's economic profit spread. McDonald's 3-year historical return on invested capital (without goodwill) is 25.5%, which is above the estimate of its cost of capital of 10%. As such, we assign the firm a ValueCreation™ rating of EXCELLENT. In the chart below, we show the probable path of ROIC in the years ahead based on the estimated volatility of key drivers behind the measure. The solid grey line reflects the most likely outcome, in our opinion, and represents the scenario that results in our fair value estimate.


Cash Flow Analysis

Firms that generate a free cash flow margin (free cash flow divided by total revenue) above 5% are usually considered cash cows. McDonald's free cash flow margin has averaged about 16% during the past 3 years. As such, we think the firm's cash flow generation is relatively STRONG. The free cash flow measure shown above is derived by taking cash flow from operations less capital expenditures and differs from enterprise free cash flow (FCFF), which we use in deriving our fair value estimate for the company. For more information on the differences between these two measures, please visit our website. At McDonald's, cash flow from operations increased about 10% from levels registered two years ago, while capital expenditures expanded about 43% over the same time period.
Valuation Analysis
The estimated fair value of $84 per share represents a price-to-earnings (P/E) ratio of about 15.7 times last year's earnings and an implied EV/EBITDA multiple of about 9.9 times last year's EBITDA. Our model reflects a compound annual revenue growth rate of 4.9% during the next five years, a pace that is lower than the firm's 3-year historical compound annual growth rate of 6.6%. Our model reflects a 5-year projected average operating margin of 32.3%, which is above McDonald's trailing 3-year average. Beyond year 5, we assume free cash flow will grow at an annual rate of 3% for the next 15 years and 3% in perpetuity. For McDonald's, we use a 10% weighted average cost of capital to discount future free cash flows.


(click to enlarge)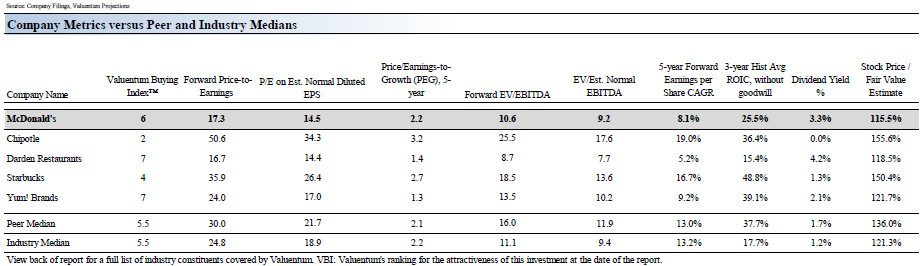
Margin of Safety Analysis
Our discounted cash flow process values each firm on the basis of the present value of all future free cash flows. Although we estimate the firm's fair value at about $84 per share, every company has a range of probable fair values that's created by the uncertainty of key valuation drivers (like future revenue or earnings, for example). After all, if the future was known with certainty, we wouldn't see much volatility in the markets as stocks would trade precisely at their known fair values. Our ValueRisk™ rating sets the margin of safety or the fair value range we assign to each stock. In the graph below, we show this probable range of fair values for McDonald's. We think the firm is attractive below $67 per share (the green line), but quite expensive above $101 per share (the red line). The prices that fall along the yellow line, which includes our fair value estimate, represent a reasonable valuation for the firm, in our opinion.

Future Path of Fair Value
We estimate McDonald's fair value at this point in time to be about $84 per share. As time passes, however, companies generate cash flow and pay out cash to shareholders in the form of dividends. The chart below compares the firm's current share price with the path of McDonald's expected equity value per share over the next three years, assuming our long-term projections prove accurate. The range between the resulting downside fair value and upside fair value in Year 3 represents our best estimate of the value of the firm's shares three years hence. This range of potential outcomes is also subject to change over time, should our views on the firm's future cash flow potential change. The expected fair value of $104 per share in Year 3 represents our existing fair value per share of $84 increased at an annual rate of the firm's cost of equity less its dividend yield. The upside and downside ranges are derived in the same way, but from the upper and lower bounds of our fair value estimate range.

Pro Forma Financial Statements
(click to enlarge)
(click to enlarge)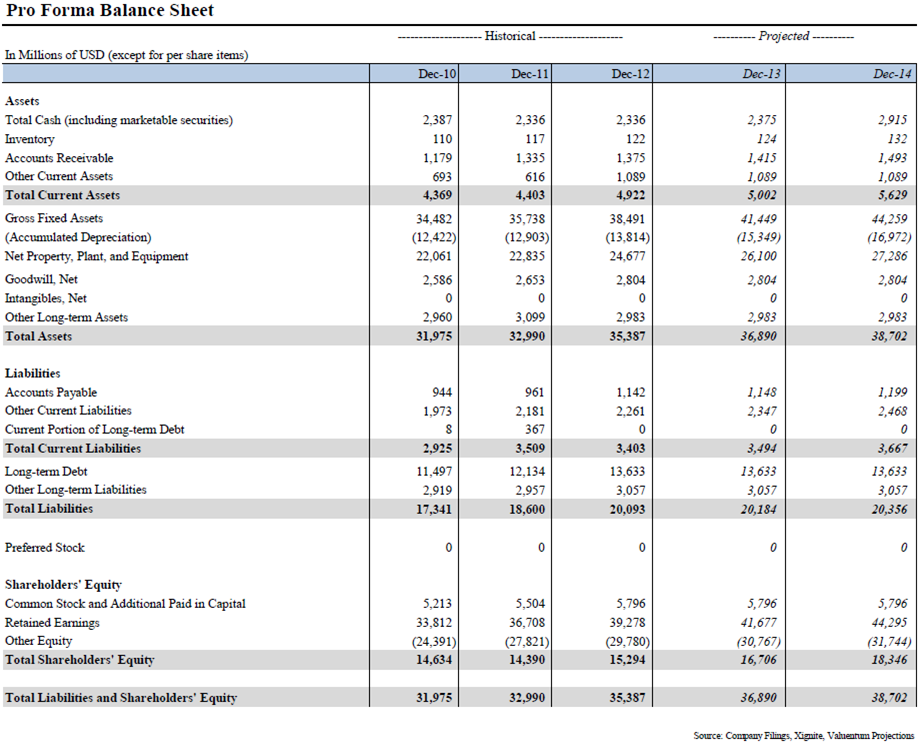
(click to enlarge)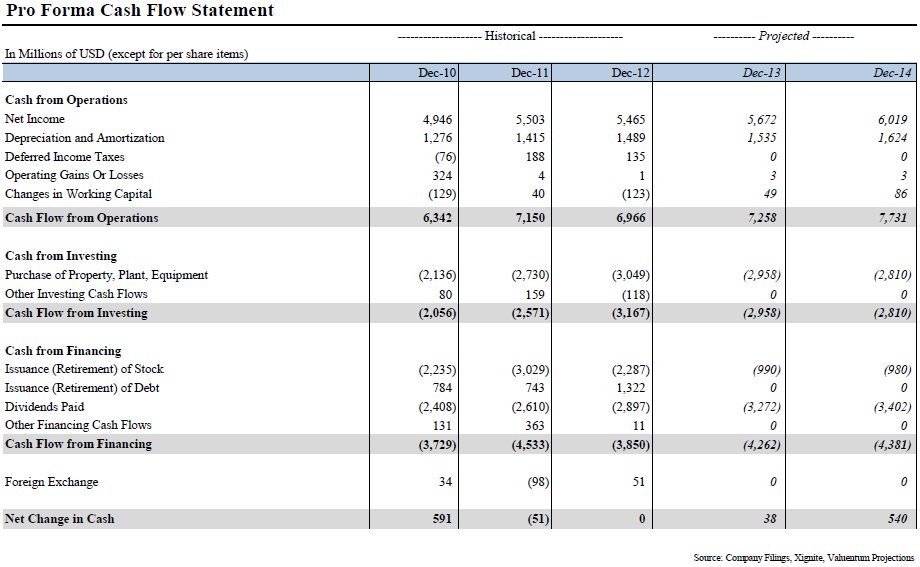
Disclosure: I have no positions in any stocks mentioned, and no plans to initiate any positions within the next 72 hours. I wrote this article myself, and it expresses my own opinions. I am not receiving compensation for it (other than from Seeking Alpha). I have no business relationship with any company whose stock is mentioned in this article. (More...)
This entry passed through the Full-Text RSS service — if this is your content and you're reading it on someone else's site, please read the FAQ at fivefilters.org/content-only/faq.php#publishers.
Aucun commentaire:
Enregistrer un commentaire