As many people are trading in their laptops for mobile devices, the mobile ad business is expected to "skyrocket". With the face of advertising businesses changing, companies that are adapting to the increasing use of mobile devices will be the ones that will secure market share. As advertising is Facebook's (FB) core business, the price that advertisers pay each time someone clicks on an ad is extremely important for the bottom line of the company.
Facebook Inc., is a social networking website which builds products that creates utility for users, developers, and advertisers. It is a company on the forefront of this advertising change.
In the section below, I will analyze aspects of Facebook's past performance. From this evaluation, we will be able to see how Facebook has fared over the past four years regarding their profitability, debt and capital, and operating efficiency. Based on this information, we will look for strengths and weaknesses in the company's fundamentals. This should give us an understanding of how the company has fared over the past few years and will give us an idea of what to expect in the future.
Profitability
Profitability is a class of financial metrics used to assess a business's ability to generate earnings compared with expenses and other relevant costs incurred during a specific period of time. In this section, we will look at four tests of profitability. They are: net income, operating cash flow, return on assets and quality of earnings. From these four metrics, we will establish if the company is making money and gauge the quality of the reported profits.
- Net income 2010 = $606 million
- Net income 2011 = $1.000 billion
- Net income 2012 = $53 million
- Net income 2013 = $1.041 billion
Over the past four years, Facebook's net profits have increased from $606 million in 2010, to $1.041 billion in 2013, which represents a 71.78% increase.
- Operating income 2010 = $1.032 billion
- Operating income 2011 = $1.756 billion
- Operating income 2012 = $538 million
- Operating income 2013 = $2.195 billion
Operating income is the cash generated from the operations of a company, generally defined as revenue less all operating expenses, but calculated through a series of adjustments to net income.
Over the past four years, Facebook's operating income has increased from $1.032 billion to $2.195 billion in 2013. This represents an increase of 112.69%.
ROE - Return on Equity
As shareholders' equity is measured as a firm's total assets minus its total liabilities, ROE reveals the amount of net income returned as a percentage of shareholders' equity. The return on equity measures a company's profitability by revealing how much profit it generates with the amount shareholders have invested.
Net Income / Shareholders' Equity
- 2010 - $ 606 million / $ 2.162 billion = 28.03%
- 2011 - $ 1.000 billion / $ 4.899 billion = 20.41%
- 2012 - $ 53 million / $ 11.755 billion = 4.51%
- 2013 - $ 1.041 billion / $ 13.048 billion = 7.98%
Over the past four years the ROE is showing a strong decreased. Since 2010 the ROE has decreased from 28.03 % to 7.98 % . As the ROE has decreased over the past four years, this reveals that there has been a decrease in how much profit has been generated compared to the amount that shareholders have invested, thus indicating a decrease in shareholder value.
Debt And Capital
The Debt and Capital section establishes if the company is sinking into debt or digging its way out. It will also determine if the company is growing organically or raising cash by selling off stock.
Total Liabilities To Total Assets, Or TL/A ratio
TL/A ratio is a metric used to measure a company's financial risk by determining how much of the company's assets have been financed by debt.
Total assets
- Total assets 2010 = $2.990 billion
- Total assets 2011 = $6.331 billion
- Total assets 2012 = $15.103 billion
- Total assets 2013 = $14.933 billion
- Equals an increase of $12.003 billion
Total liabilities
- Total liabilities 2010 = $828 million
- Total liabilities 2011 = $1.432 billion
- Total liabilities 2012 = $3.348 billion
- Total liabilities 2013 = $1.885 billion
- Equals an increase of $1.027 billion
Over the past four years, Facebook's total assets have increased by $12.003 billion, while the total liabilities have increased by $1.027 billion. This indicates that the company's assets have increased more than the liabilities thus adding shareholder value.
Working Capital
Working Capital is a general and quick measure of liquidity of a firm. It represents the margin of safety or cushion available to the creditors. It is an index of the firm's financial stability. It is also an index of technical solvency and an index of the strength of working capital.
Current Ratio = Current assets / Current liabilities
Current assets
- Current assets 2010 = $2.246 billion
- Current assets 2011 = $4.604 billion
- Current assets 2012 = $11.267 billion
- Current assets 2013 = $10.549 billion
Current liabilities
- Current liabilities 2010 = $389 million
- Current liabilities 2011 = $899 million
- Current liabilities 2012 = $1.052 billion
- Current liabilities 2013 = $984 million
- Current Ratio
- Current ratio 2010 = 5.77
- Current ratio 2011 = 5.12
- Current ratio 2012 = 10.71
- Current ratio 2013 = 10.72
Over the past four years, Facebook's current ratio has increased significantly. As the current ratio is currently well above 1, this indicates that Facebook would be able to pay off its obligations if they came due at this point.
Common Shares Outstanding
- 2010 shares outstanding = 0
- 2011 shares outstanding = 2.332 billion.
- 2012 shares outstanding = 2.166 billion
- 2013 shares outstanding = 2.528 billion

FB Shares Outstanding data by YCharts
Over the past three years, the number of company shares has increased. The company shares have increased from 2.332 billion to 2.528 billion and increase of 8.4%
Operating Efficiency
Operating Efficiency is a market condition that exists when participants can execute transactions and receive services at a price that equates fairly to the actual costs required to provide them. An operationally efficient market allows investors to make transactions that move the market further toward the overall goal of prudent capital allocation without being chiseled down by excessive frictional costs, which would reduce the risk/reward profile of the transaction.
Gross Margin: Gross Income/Sales
The Gross Profit Margin is a measurement of a company's manufacturing and distribution efficiency during the production process. The gross profit tells an investor the percentage of revenue/sales left after subtracting the cost of goods sold. A company that boasts a higher gross profit margin than its competitors and industry is more efficient. Investors tend to pay more for businesses that have higher efficiency ratings than their competitors, as these businesses should be able to make a decent profit as long as overhead costs are controlled (overhead refers to rent, utilities, etc.).
- Gross margin 2010 = $1.481 billion / $1.974 billion = 75.03%.
- Gross margin 2011 = $2.851 billion / $3.711 billion = 76.83%.
- Gross margin 2012 = $3.725 billion / $5.089 billion = 73.20%.
- Gross margin 2013 = $5.090 billion / $6.871 billion = 74.08%.
Over the past four years, Facebook's gross margin has decreased. The ratio has decreased from 75.03% in 2010 to 74.08% in 2013. Even though the decrease is not significant this is a trend that I do not want to see continue.
Asset Turnover
The formula for the asset turnover ratio evaluates how well a company is utilizing its assets to produce revenue. The numerator of the asset turnover ratio formula shows revenue found on a company's income statement and the denominator shows total assets, which are found on a company's balance sheet. Total assets should be averaged over the period of time that is being evaluated.
Revenue growth
- Revenue 2010 = $1.974 billion
- Revenue 2011 = $3.711 billion
- Revenue 2012 = $5.089 billion
- Revenue 2013 = $6.871 billion
- Equals an increase of 248.07%
Total Asset growth
- Total assets 2010 = $2.990 billion
- Total assets 2011 = $6.331 billion.
- Total assets 2012 = $15.103 billion.
- Total assets 2013 = $14.933 billion.
- Equals an increase of 399.43%.
Over the four years the revenue growth has increased by 248.07% while the assets have increased by 399.43%. This is an indication that the company from a percentage point of view has been less efficient at generating revenue with its assets.
Based on the information above we can see that Facebook has had strong start but some of the metrics have been quite volitile. An example of this volality is indicated in the net income. Over the past four years the net income has increased by 71.78% but it has been a "bumpy ride" to get there. Facebook's revenue has increased by 248.07% since 2010 indicating astonishing growth. A couple of blemishes that the analysis reveals are: A decrease in the gross margin and a decrease in the ROE. Over the past four years the gross margin has fallen from 75.03% to 74.08% while the ROE has decreased to 7.98% from 28.03% in 2010.
Catalysts for Growth
Over the past couple of years the mobile ad market has increased significantly. According to Emarketer, mobile internet ad spending worldwide is expected to top $18.5 billion by the end of this year. This now accounts for 15.2% of all digital ad dollars spent which is up immensely from 8.2% in 2012.
A study by research firm eMarketer concluded that mobile ad spending doubled in 2013 to $9.6 billion. The figure will "skyrocket" over the coming years, eclipsing the money spent on desktop ads by 2016.
Google (GOOG) currently has the market share of the mobile ad dollars but Facebook is beginning to "make waves" in this space. As the chart below indicates, Facebook jumped from 5.34% to almost 17% in just one year.

In the U.S. estimates indicate that internet ad dollars will increase in excess of $14.5 billion by 2017. Mobile ad dollars are expected account for an increasing share of display revenue and represent nearly 50% of the total U.S. display ad dollars by 2017.

As the face of advertising changes, companies who are on the leading edge of the mobile advertising phenomenon should reap the rewards of this transition. As the mobile advertising market both globally and domestically in the U.S. are expected to increase significant this will drive growth for Facebook into the future.
Recently, Cantor Fitzgerald analyst Youssef Squali raised his price target to $65 as the company nearly doubled the percentage of advertising in users' news feeds during the holiday season.
Valuations
In the section below, I will use a couple of different methods to find a valuation of the stock price. In this section, I will use the Discounted Cash Flow valuation model and forward P/E ratios to estimate the current value of each share.
I believe using the Discounted Cash Flow valuation model for Facebook to be fair because DCF analysis can help one see where the company's value is coming from and one can generate an opinion based on that.
(click to enlarge)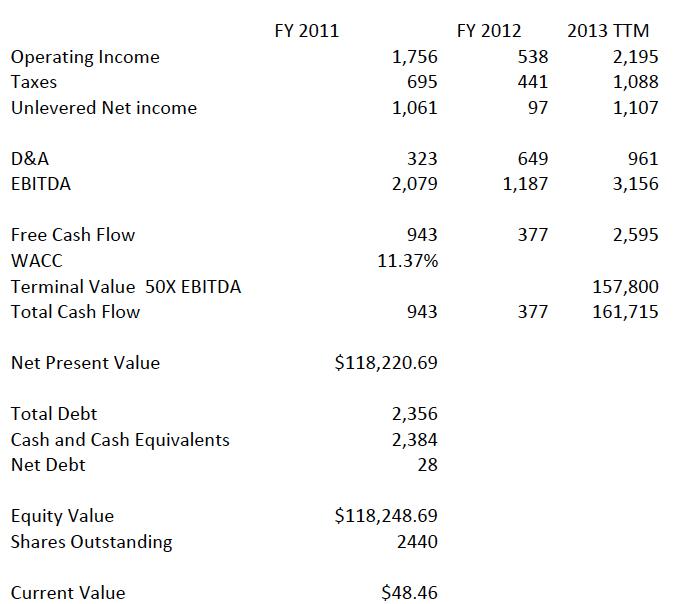
Even though there are variations in calculating this formula, this model is based off of a terminal value of $157.800B and a WACC of 11.37%. The terminal value $157.800B is based off of the company trading at 50X EBITDA. Currently the stock price is trading a 60x EBITDA. At this point in the market, I can't justify any more than 50x EBITDA as forward P/E ratio is estimated at 51.26. The EBITDA should trade at a discount to this value. Using the valuations above, I have concluded Facebook's current value to be $48.46 per share.
Looking forward to 2014, I will use Facebook's forward P/E ratios with estimated earnings to find the value. Currently, Google has a forward P/E of 51.26 and FY 2015 earnings projected at $1.19. These two metrics lead to a target price of $61.00.
As of December 24th, Facebook's stock was trading at $58.04 - Using the Discount Cash Flow Formula, this indicates the stock is currently overvalued by 19.80%. Looking forward to 2014, If I calculate a valuation using a forward P/E of 21.35 ratios this indicates a valuation $61.00 or a discount of 5.10%.

Strategy
At this point in the market, I believe Santa Clause is being very nice to Facebook. I would not be surprised if there was a 5-10% correction in January as the Santa Clause Rally ends. If one was interested in purchasing this stock I would look for the support level around the $48.00 mark to enter. Currently, I believe there is further upside to equity markets as major world economies are either recovering or on the verge of recovering. As interest rates continue to remain near zero this should favor equities.
Conclusion
Currently, I have a hard time valuing the stock any higher than 50X EBITDA which indicates a value of $48.46. Currently, I believe the market is getting ahead of itself regarding the valuation of Facebook. Having stated that, as the mobile advertising dollars add to the growth of the company, earnings per share growth is expected to increase significantly over the next couple of years. As estimates indicate that Facebook will produce an EPS of $1.19 in 2015 combine that with a forward P/E ratio of 51.26 this produces a 2014 target of $61.00. At current levels using the Discount Cash Flow Formula, I believe the stock is overvalued but a decent pull-back would represent an excellent investment opportunity.
Disclosure: I have no positions in any stocks mentioned, and no plans to initiate any positions within the next 72 hours. I wrote this article myself, and it expresses my own opinions. I am not receiving compensation for it (other than from Seeking Alpha). I have no business relationship with any company whose stock is mentioned in this article. (More...)
This entry passed through the Full-Text RSS service — if this is your content and you're reading it on someone else's site, please read the FAQ at fivefilters.org/content-only/faq.php#publishers.
Aucun commentaire:
Enregistrer un commentaire