The Sharpe ratio, introduced by William F. Sharpe from Stanford University in 1966, is a way to examine the performance of an investment by adjusting for its risk. In my previous post, I described the best S&P 500 dividend stocks based on their reward to risk ratio. In this article I describe the best mid-cap dividend stocks which are included in the S&P MidCap 400 index, according to the same principles.
I used the Portfolio123's powerful screener to rank all the S&P MidCap 400 index stocks, which pay a dividend with a higher than 1% yield and have a payout ratio less than 100%, according to their Sharpe ratio.
The tables below show the best twenty S&P MidCap 400 stocks according to this concept. In this article, I describe the first seven stocks. In my opinion, these stocks can reward an investor a capital gain along with an income. I recommend readers to use this list of stocks as a basis for further research. All the data for this article were taken from Yahoo Finance, Portfolio123 and finviz.com, on December 19, before the market open.
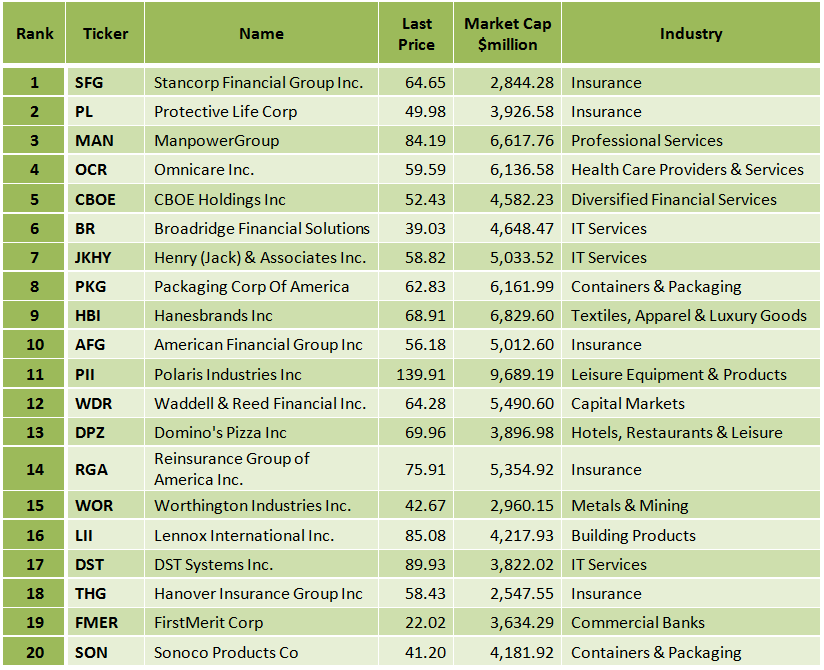
(Click to enlarge)
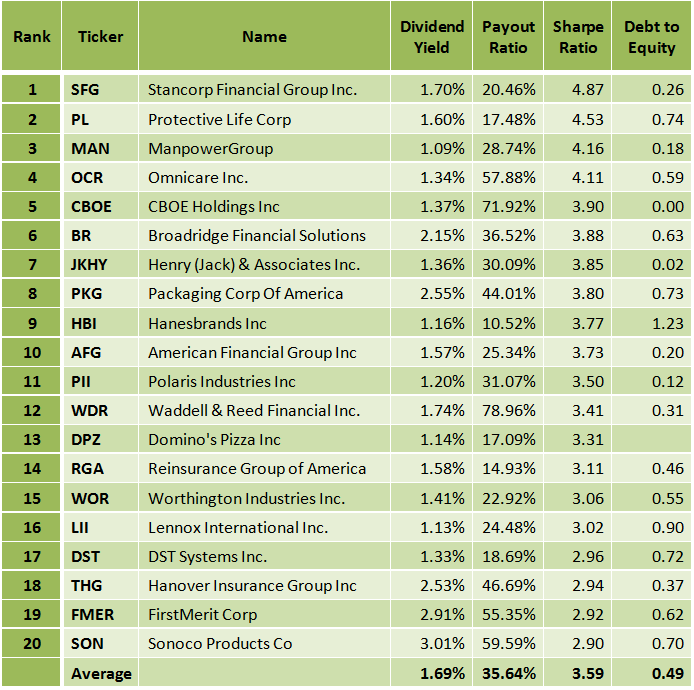
(Click to enlarge)
Stancorp Financial Group Inc. (SFG)
StanCorp Financial Group, Inc., together with its subsidiaries, provides financial products and services in the United States.
StanCorp has a very low debt (total debt to equity is only 0.26) and it has a low trailing P/E of 14.24 and a very low forward P/E of 12.87. The PEG ratio is very low at 0.78, and the price-to-sales ratio is also very low at 1.00. The price to free cash flow for the trailing 12 months is very low at 11.07, and the average annual earnings growth estimates for the next five years is very high at 18.20%. The forward annual dividend yield is at 1.70%, and the payout ratio is only 20.5%.
The SFG stock price is 1.06% above its 20-day simple moving average, 6.25% above its 50-day simple moving average and 27.23% above its 200-day simple moving average. That indicates a short-term, a mid-term and a long-term uptrend.
On October 22, StanCorp reported its third-quarter financial results, which beat EPS expectations by $0.38. The company reported net income of $59.0 million, or $1.32 per diluted share for the third quarter of 2013, compared to net income of $44.9 million, or $1.01 per diluted share for the third quarter of 2012. In the report, Greg Ness, chairman, president and chief executive officer said:
Our business lines reported excellent results for the third quarter of 2013, which included a very favorable group insurance benefit ratio and record earnings in our Asset Management segment. We are seeing the benefits from the pricing actions that we have taken and are executing on our plan to deliver long-term shareholder value.
StanCorp Financial Group has compelling valuation metrics and strong earnings growth prospects, and considering the fact that the stock is in an uptrend, SFG stock can move higher. Furthermore, the solid dividend represents a nice income.


(Click to enlarge)
Chart: finviz.com
Protective Life Corporation (PL)
Protective Life Corporation, together with its subsidiaries, provides financial services primarily in the United States.
Protective Life has a very low trailing P/E of 11.87 and a very low forward P/E of 10.55. The price to free cash flow is very low at 5.90, and the price-to-sales ratio is also low at 1.07. The price to book value is low at 1.09, and the average annual earnings growth estimates for the next five years is at 9.77%. The forward annual dividend yield is at 1.60%, and the payout ratio is only 17.5%.
The PL stock price is 3.80% above its 20-day simple moving average, 7.07% above its 50-day simple moving average and 21.30% above its 200-day simple moving average. That indicates a short-term, a mid-term and a long-term uptrend.
Protective Life Corporation has recorded EPS, revenue and dividend growth, during the last three years, as shown in the table below.

Most of Protective Life Corporation's stock valuation parameters have been better than its industry median, sector median and the S&P 500 index, as shown in the table below.

(Click to enlarge)
On October 30, Protective Life Corporation reported its third-quarter financial results, which beat EPS expectations by $0.01. The company reported that net income available to PLC's common shareowners for the third quarter of 2013 was $93.1 million or $1.15 per average diluted share, compared to $60.5 million or $0.73 per average diluted share in the third quarter of 2012. After-tax operating income was $79.5 million or $0.98 per average diluted share, compared to $63.0 million or $0.76 per average diluted share in the third quarter of 2012. In the report, John D. Johns, Chairman, President and CEO said:
We are very pleased to report another solid quarter. Notwithstanding the headwinds created by the low interest rate environment, an unsettled regulatory environment and intense competition across all retail product lines, we continue to stay on track to meet our sales, capital and earnings plans for the year. We are particularly pleased to have the MONY transaction closed and expect this acquisition to be immediately accretive to our bottom line in the fourth quarter.
Protective Life Corporation has recorded EPS, revenue and dividend growth, and considering its compelling valuation metrics, and the fact that the stock is in an uptrend and is trading near book value, PL stock can move higher. Furthermore, the solid dividend represents an income.


(Click to enlarge)
Chart: finviz.com
ManpowerGroup Inc. (MAN)
ManpowerGroup Inc. provides workforce solutions and services.
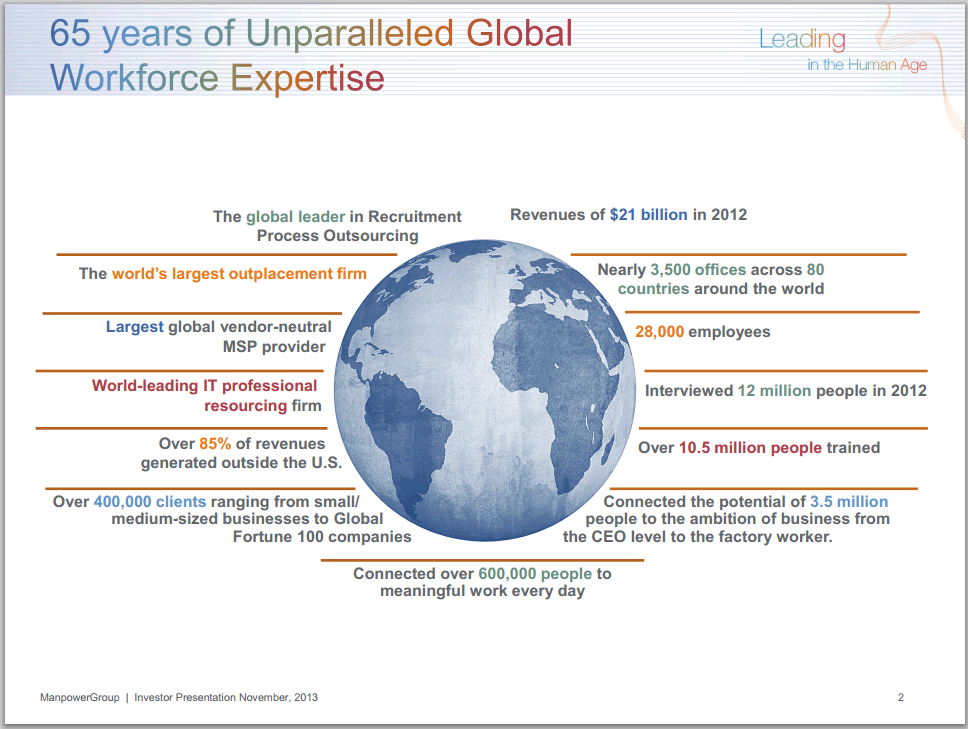
(Click to enlarge)
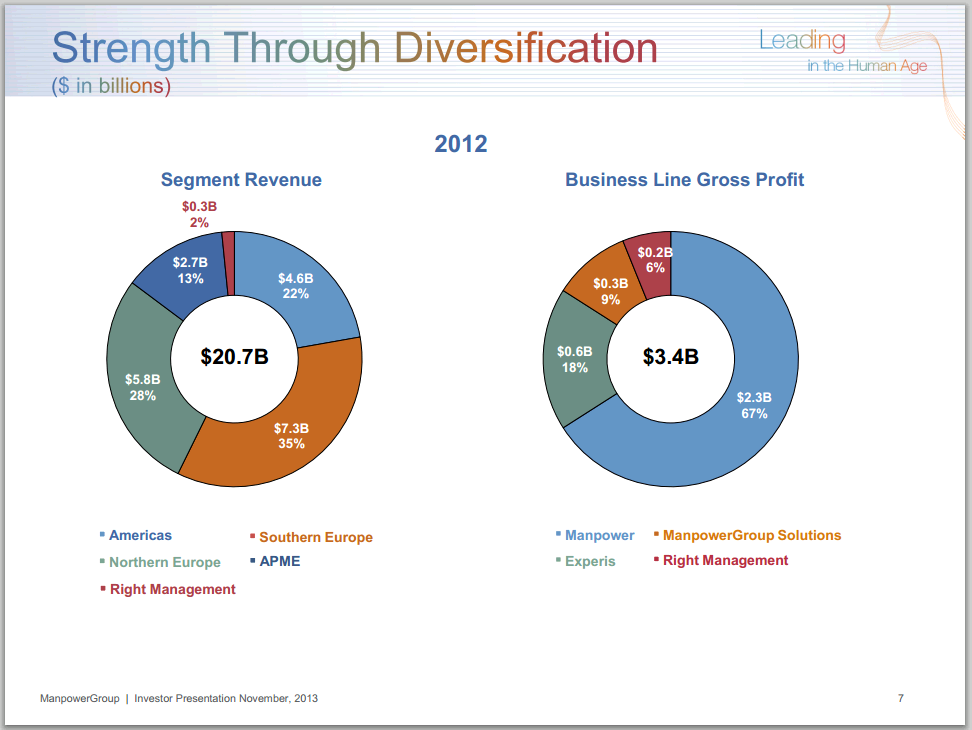
(Click to enlarge)
Source: JP MORGAN ULTIMATE SERVICES INVESTOR CONFERENCE
ManpowerGroup has a very low debt (total debt to equity is only 0.18), and it has a trailing P/E of 27.69 and a forward P/E of 18.13. The price-to-sales ratio is very low at 0.33, and the average annual earnings growth estimates for the next five years is quite high at 14.92%. The forward annual dividend yield is at 1.09%, and the payout ratio is only 28.7%.
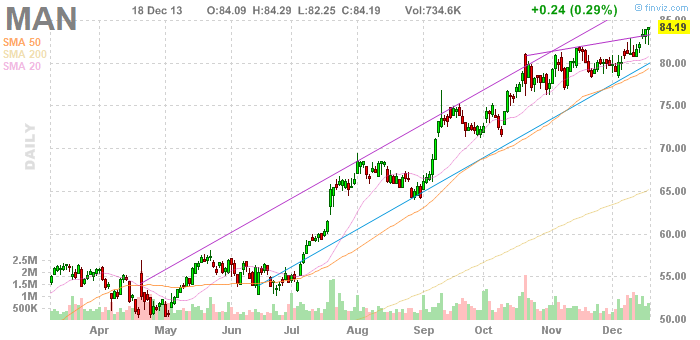
The MAN stock price is 4.40% above its 20-day simple moving average, 6.32% above its 50-day simple moving average and 29.36% above its 200-day simple moving average. That indicates a short-term, a mid-term and a long-term uptrend.
ManpowerGroup has recorded EPS, revenue and dividend growth, during the last three years, as shown in the table below.

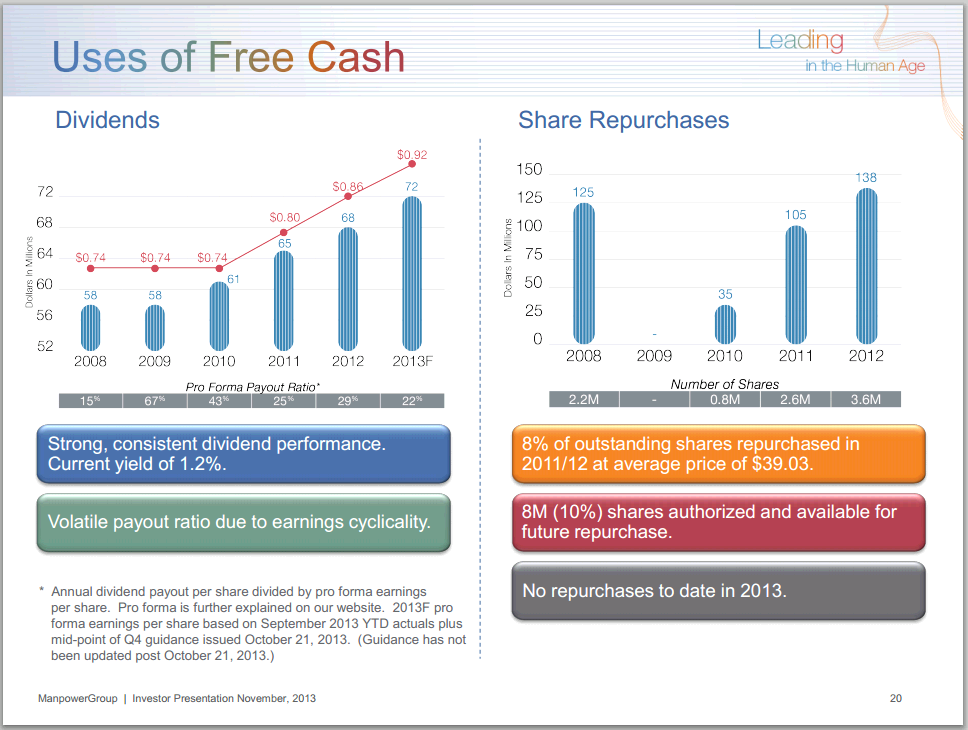
ManpowerGroup has returned value to its shareholders by share repurchases and by increasing dividend payments, as shown in the table below.
(Click to enlarge)
Source: JP MORGAN ULTIMATE SERVICES INVESTOR CONFERENCE
On October 21, ManpowerGroup reported its third-quarter financial results, which beat EPS expectations by $0.16 and beat on revenues. The company reported that earnings per diluted share for the three months ended September 30, 2013 were $1.18 compared to 79 cents in the prior year period. Net earnings in the quarter were $94.7 million compared to $63.1 million a year earlier. Revenues for the third quarter were $5.2 billion, which is in line with the prior year period.
In the report, Jeffrey A. Joerres, ManpowerGroup Chairman and CEO, said:
We continue to experience positive momentum in all of the established strategic focus areas. Our strong results for the third quarter were driven by more positive revenue trends and operational leverage achieved through our re-calibration efforts. Our European operations' revenue experienced slow but steadily improving trends throughout the quarter. Our team across the world remains positive and all of our brands are well positioned as we enter the fourth quarter.
ManpowerGroup has recorded EPS, revenue and dividend growth, and considering its strong earnings growth prospects, and the fact that the stock is in an uptrend, MAN stock can move higher. Furthermore, the solid dividend represents an income.

(Click to enlarge)
Chart: finviz.com
Omnicare Inc. (OCR)
Omnicare, Inc. operates as a healthcare services company that specializes in the management of pharmaceutical care in the United States and Canada.
Omnicare has a forward P/E of 15.09. The price to free cash flow is very low at 14.37, and the price-to-sales ratio is also low at 0.98. The price to book value is at 1.82, and the average annual earnings growth estimates for the next five years is high at 15%. The forward annual dividend yield is at 1.34%, and the payout ratio is at 57.9%. The annual rate of dividend growth over the past three years was very high at 74.33%%, and over the past five years was also very high at 42.87%.
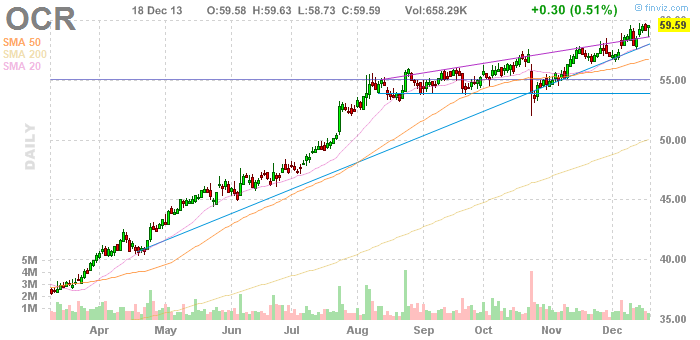
The OCR stock price is 2.85% above its 20-day simple moving average, 5.02% above its 50-day simple moving average and 19.14% above its 200-day simple moving average. That indicates a short-term, a mid-term and a long-term uptrend.
Omnicare has recorded strong EPS and dividend growth and weak revenue growth, during the last five years, as shown in the table below.

Most of Omnicare's stock valuation parameters have been better than its industry median, sector median and the S&P 500 index, as shown in the table below.
(Click to enlarge)
On October 23, Omnicare reported its third-quarter financial results, which beat EPS expectations by $0.01 and beat on revenues.
Third-Quarter Highlights:
- Net sales increase of 5.3% to $1.6 billion
- Adjusted cash earnings per diluted share 5.8% higher to $0.91; GAAP loss per share of $0.65 attributable to a voluntary civil settlement, described in further detail in the "Footnotes and Definitions to Financial Information" section below
- Cash flows from operations of $192 million
In the report, John L. Workman, Omnicare`s Chief Executive Officer said:
Omnicare`s underlying operating performance continues to improve, which brings further confirmation that our ongoing initiatives remain on track. Our third quarter financial results benefited from the continued strong performance of our Specialty Care Group and our ongoing sales and service initiatives within Long-Term Care, which more than offset softer results within our hospice pharmacy business.
Omnicare has recorded EPS, revenue and dividend growth, and considering its strong earnings growth prospects, and the fact that the stock is in an uptrend, OCR stock can move higher. Furthermore, the solid strong growing dividend represents an income.

(Click to enlarge)
Chart: finviz.com
CBOE Holdings, Inc. (CBOE)
CBOE Holdings, Inc., through its subsidiaries, operates markets for the trading of listed derivatives.
CBOE Holdings has no debt at all, and it has a trailing P/E of 27.45 and a forward P/E of 23.18. The current ratio is very high at 4.70, and the average annual earnings growth estimates for the next five years is quite high at 14.35%. The forward annual dividend yield is at 1.37%, and the payout ratio is at 71.9%.
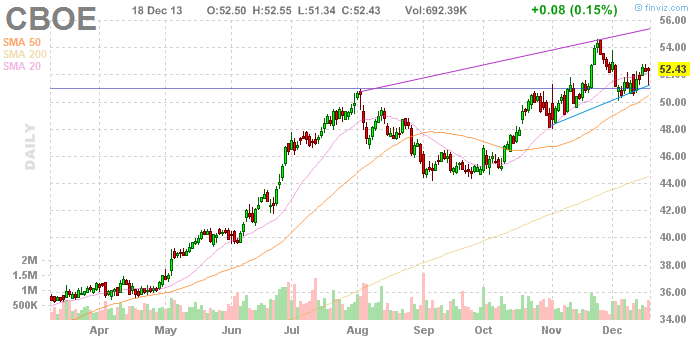
The CBOE stock price is 0.52% above its 20-day simple moving average, 4.13% above its 50-day simple moving average and 17.79% above its 200-day simple moving average. That indicates a short-term, a mid-term and a long-term uptrend.
CBOE Holdings has recorded EPS and revenue growth, during the last year, the last three years and the last five years, as shown in the charts below.

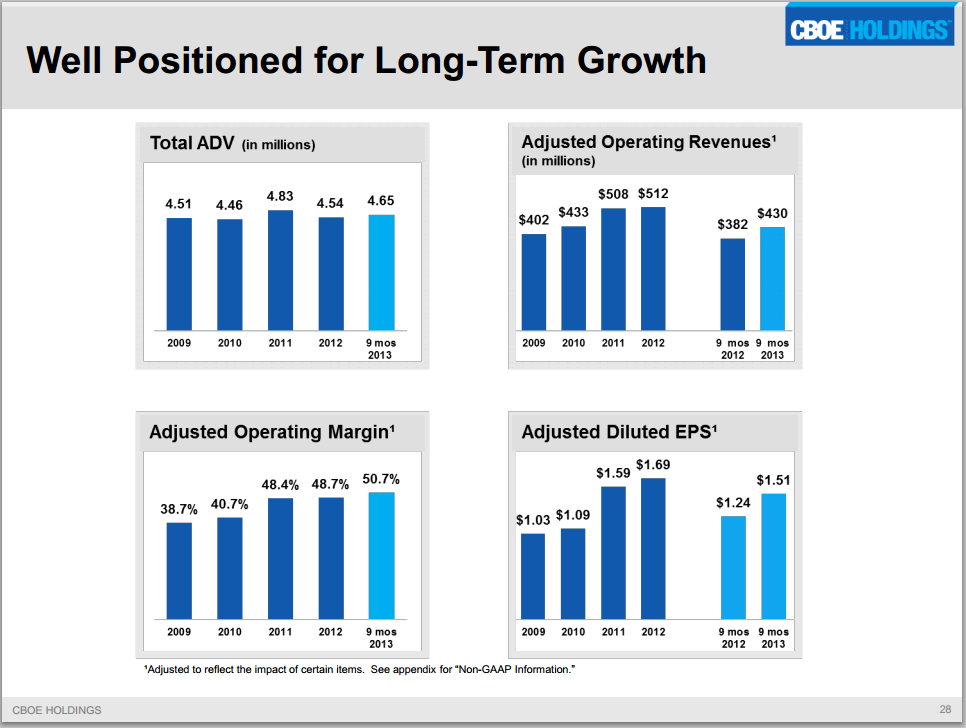
(Click to enlarge)
Source: company presentation
On November 01, CBOE Holdings reported its third-quarter financial results, which beat EPS expectations by $0.02.
Third Quarter 2013 Financial Highlights
- Operating Revenue Increases 7 Percent to $136.7 Million
- GAAP Net Income Allocated to Common Stockholders of $41.0 Million, Compared With $45.2 Million; Diluted EPS of $0.47, Compared With $0.52
- Adjusted Net Income Allocated to Common Stockholders Up 9 Percent to $41.0 Million; Adjusted Diluted EPS of $0.47, Up 9 Percent
- Operating Margin of 50.0 Percent, Up 260 Basis Points
CBOE Holdings has recorded EPS and revenue growth, and considering its strong earnings growth prospects, and the fact that the stock is in an uptrend, CBOE stock can move higher. Furthermore, the solid dividend represents an income.

(Click to enlarge)
Chart: finviz.com
Broadridge Financial Solutions, Inc. (BR)
Broadridge Financial Solutions, Inc. provides technology solutions to the financial services industry in the United States, Canada, and the United Kingdom.
Broadridge Financial Solutions has a trailing P/E of 20.33 and a forward P/E of 16.36. The PEG ratio is at 1.69, and the average annual earnings growth estimates for the next five years is quite high at 12%. The forward annual dividend yield is at 2.15%, and the payout ratio is only 36.5%. The annual rate of dividend growth over the past three years was high at 9.58% and over the past five years was very high at 24.57%.
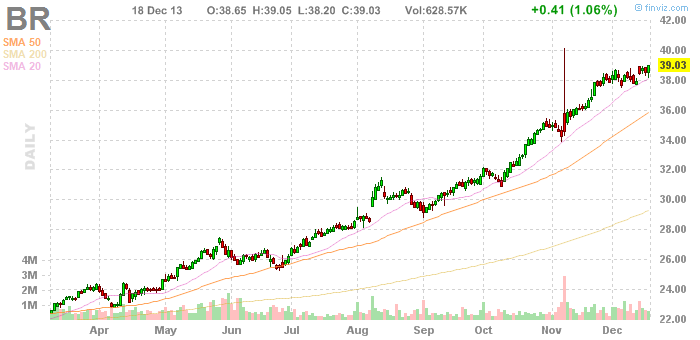
The BR stock price is 2.58% above its 20-day simple moving average, 9.16% above its 50-day simple moving average and 33.52% above its 200-day simple moving average. That indicates a short-term, a mid-term and a long-term uptrend.
Broadridge Financial Solutions has recorded revenue, EPS and dividend growth during the last year, the last three years and the last five years, as shown in the table below.

On November 07, Broadridge reported its first-quarter fiscal 2014 financial results, which beat EPS expectations by $0.19 and beat on revenues.
Broadridge Financial Solutions has good earnings growth prospects, and considering the fact that the stock is in an uptrend, BR stock still has room to go up. Furthermore, the rich growing dividend represents a nice income.

(Click to enlarge)
Chart: finviz.com
Jack Henry & Associates Inc. (JKHY)
Jack Henry & Associates, Inc. provides technology solutions and payment processing services primarily for financial services organizations in the United States.
Jack Henry & Associates has a very low debt (total debt to equity is only 0.02), and it has a trailing P/E of 27.62 and a forward P/E of 22.48. The average annual earnings growth estimates for the next five years is quite high at 11.50%. The forward annual dividend yield is at 1.36%, and the payout ratio is only 30.1%.
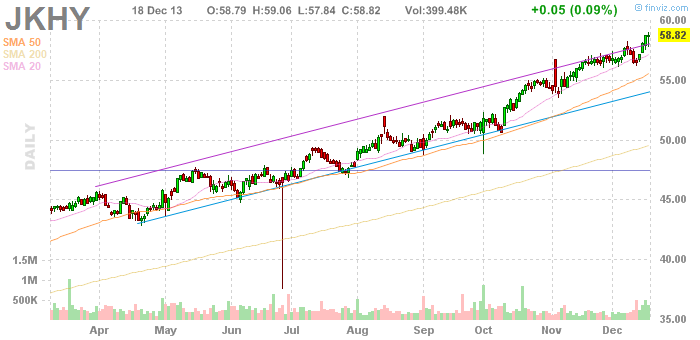
The JKHY stock price is 3.09% above its 20-day simple moving average, 6.06% above its 50-day simple moving average and 18.82% above its 200-day simple moving average. That indicates a short-term, a mid-term and a long-term uptrend.
Jack Henry & Associates has recorded strong EPS, revenue and dividend growth, during the last year, the last three years and the last five years, as shown in the table below.

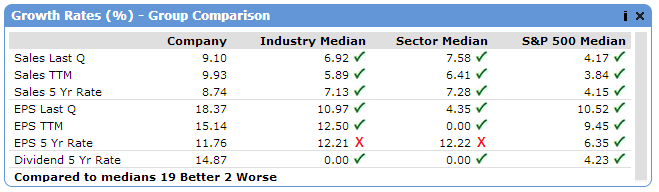
Most of Jack Henry & Associates' growth rates, margins and return on capital parameters have been better than its industry median, sector median and the S&P 500 median, as shown in the tables below.
(Click to enlarge)
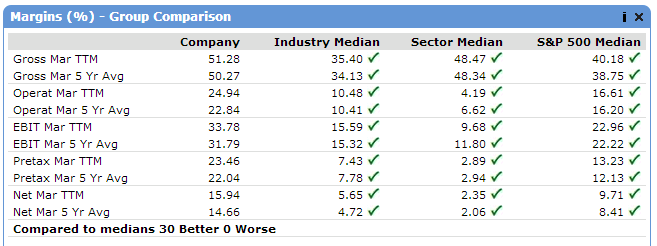
(Click to enlarge)

(Click to enlarge)
Jack Henry & Associates is returning value to its shareholders by share repurchases and by increasing dividend payments, as shown in the charts below.
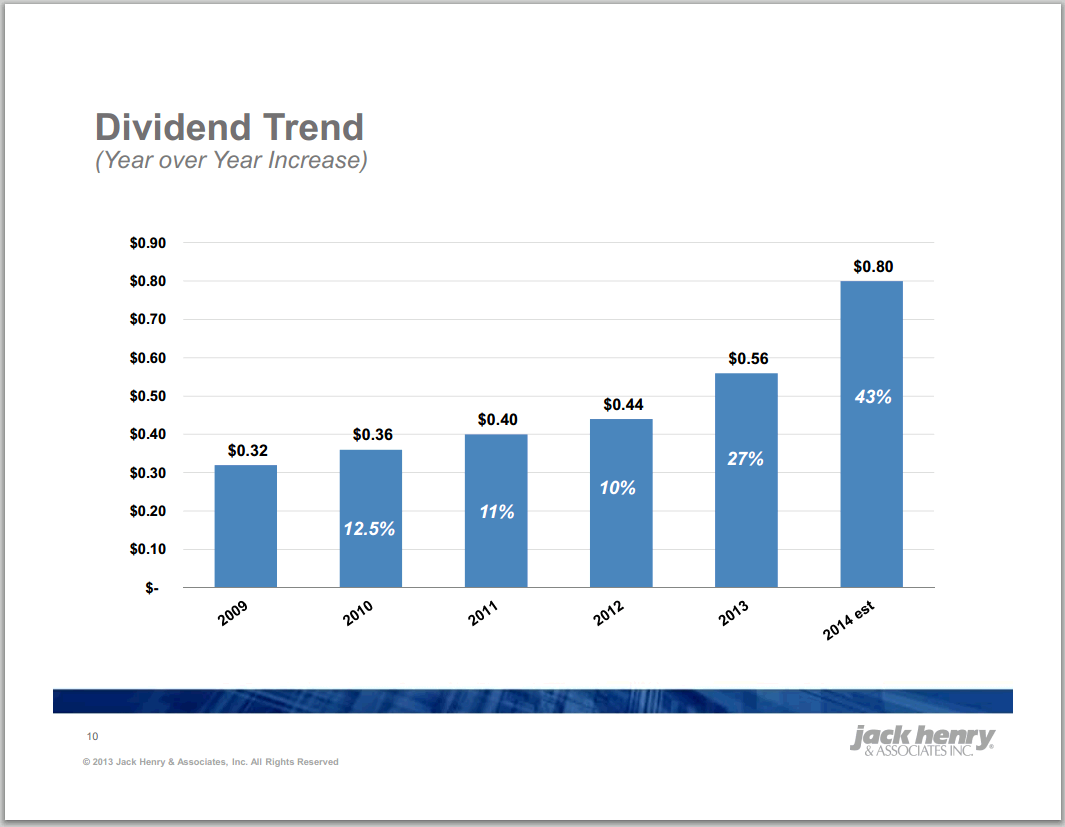
(Click to enlarge)
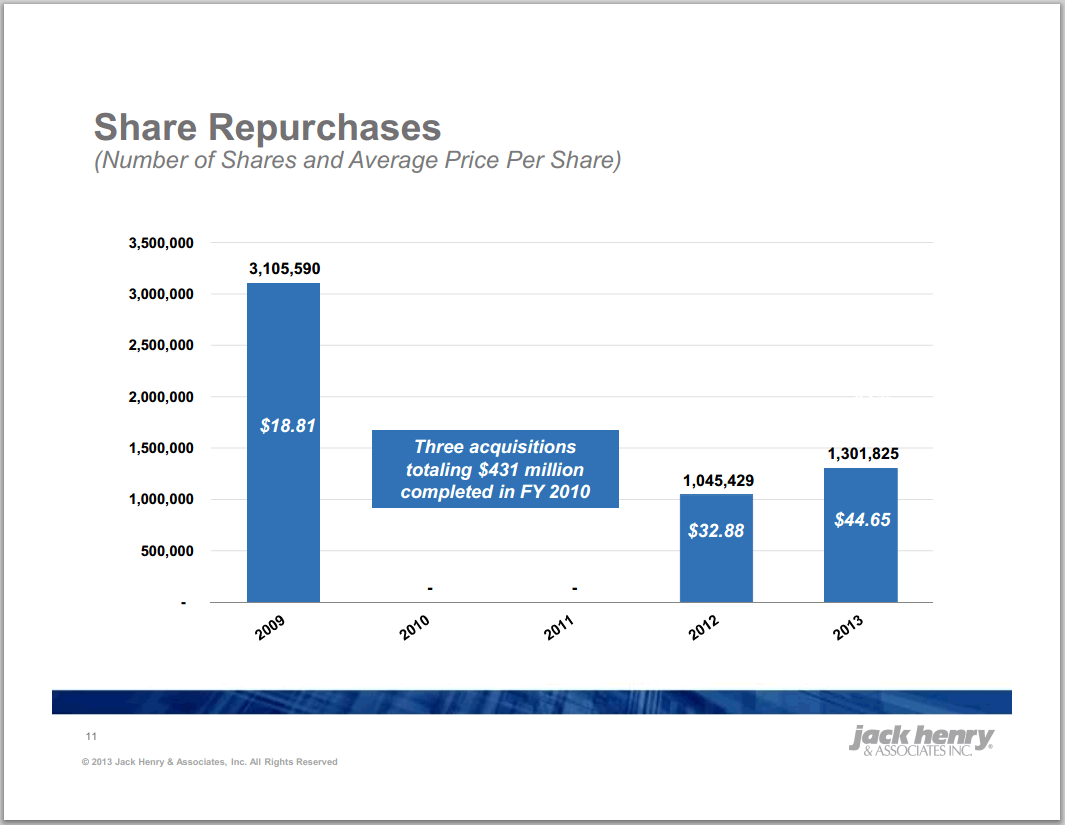
(Click to enlarge)
Source: Annual Shareholder Meeting
On November 05, Jack Henry & Associates reported its first-quarter fiscal 2014 financial results, which beat EPS expectations by $0.01 and was in-line on revenues. For the quarter ended September 30, 2013, the company generated total revenue of $295.7 million compared to $271.0 million in the same quarter a year ago. Gross profit increased to $128.7 million from $115.9 million in the first quarter of last fiscal year. Net income in the current quarter was $49.8 million, or $0.58 per diluted share, compared to $42.5 million, or $0.49 per diluted share in the same quarter a year ago.
Jack Henry & Associates has recorded strong EPS, revenue and dividend growth, and considering its good earnings growth prospects, and the fact that the stock is in an uptrend, JKHY stock can move higher. Furthermore, the solid dividend represents an income.

(Click to enlarge)
(Click to enlarge)
Chart: finviz.com
Disclosure: I have no positions in any stocks mentioned, and no plans to initiate any positions within the next 72 hours. I wrote this article myself, and it expresses my own opinions. I am not receiving compensation for it (other than from Seeking Alpha). I have no business relationship with any company whose stock is mentioned in this article. (More...)
This entry passed through the Full-Text RSS service — if this is your content and you're reading it on someone else's site, please read the FAQ at fivefilters.org/content-only/faq.php#publishers.
Aucun commentaire:
Enregistrer un commentaire