Many technology companies are paying dividends. According to Portfolio123's database, 644 companies with a market cap greater than $100 million and price greater than $1.00 are classified as technology. Among these companies, 163 companies are paying dividends, and 71 of them have a dividend yield greater than 2.0%.
I have searched for highly profitable technology stocks that pay very rich dividends with a low payout ratio. Those stocks would also have to show a low debt and a low P/E ratio.
I used the Portfolio123's powerful screener to perform the search. The screen's formula requires all stocks to comply with all following demands:
- The stock does not trade over-the-counter [OTC].
- Market cap is greater than $100 million.
- Price is greater than 1.00.
- Sector is Technology.
- Dividend yield is greater than 3.0%.
- The payout ratio is less than 100%.
- Total debt to equity is less than 0.80.
- Forward P/E is less than 15.
As a result, only seven stocks came out, as shown in the charts below. In my opinion, these stocks can reward an investor a capital gain along with a high income. I recommend readers use this list of stocks as a basis for further research. All the data for this article were taken from Portfolio123 and finviz.com, on December 23, before the market open.
(click to enlarge)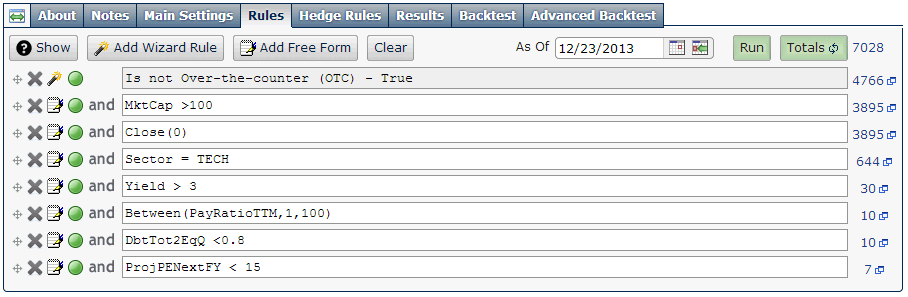
(click to enlarge)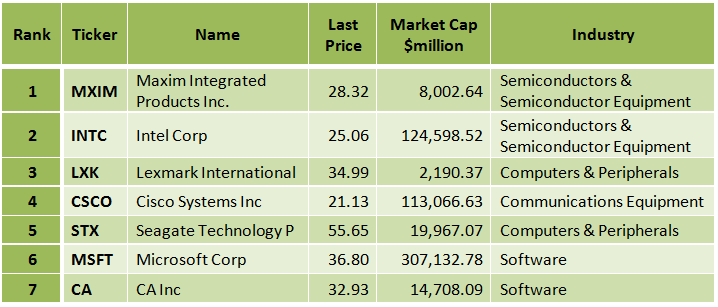
(click to enlarge)
Maxim Integrated Products, Inc. (MXIM)
Maxim Integrated Products, Inc. engages in designing, developing, manufacturing, and marketing various linear and mixed-signal integrated circuits worldwide.
Maxim Integrated Products has a very low debt (total debt to equity is only 0.21), and it has a trailing P/E of 19.67 and a very low forward P/E of 13.56. The PEG ratio is at 1.77, and the price-to-cash ratio is at 7.79. The current ratio is very high at 5.30, and the average annual earnings growth estimates for the next five years is quite high at 11.10%. The forward annual dividend yield is quite high at 3.67%, and the payout ratio is at 66.4%. The annual rate of dividend growth over the past three years was at 6.54% and over the past five years was at 5.06%.
Maxim has recorded revenue, EPS and dividend growth, during the last year, the last three years and the last five years, as shown in the table below.

Maxim's margins and return on capital parameters have been better than its industry median, sector median and the S&P 500 median, as shown in the tables below.
(click to enlarge)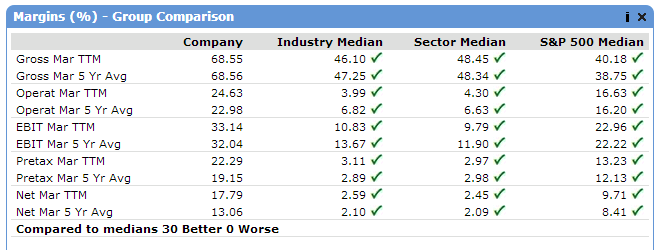
(click to enlarge)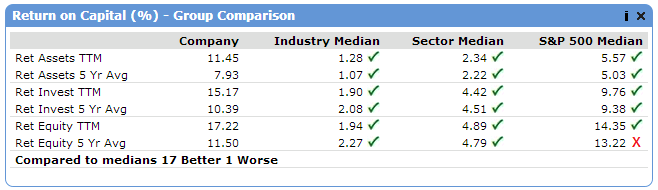
Source: Portfolio123
On October 24, Maxim reported its first-quarter fiscal 2014 financial results, which beat EPS expectations by $0.02.
First-Quarter Fiscal 2014 Financial Highlights
- Revenue: $585 million
- Gross Margin: 59.3% GAAP (60.7% excluding special items)
- EPS: $0.36 GAAP ($0.41 excluding special items)
- Cash, cash equivalents, and short term investments: $1.03 billion
- Fiscal first quarter results exclude Volterra Semiconductor
- Fiscal second quarter revenue outlook: $605 million to $635 million, including $35 million to $37 million of revenue from Volterra
Maxim has recorded revenue, EPS and dividend growth, and considering its cheap valuation metrics and its good earnings growth prospects, MXIM stock still has room to go up. Furthermore, the rich growing dividend represents a nice income.
Since the company is rich in cash ($3.63 a share) and has a low debt and its payout ratio is low, there is a hardly risk that the company will reduce its dividend payment. Risks to the expected capital gain include a downturn in the U.S. economy and weakness in the electronics market.
(click to enlarge)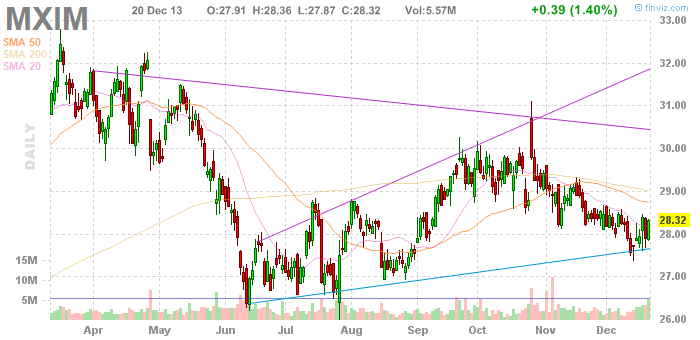
Chart: finviz.com
Intel Corporation (INTC)
Intel Corporation designs, manufactures, and sells integrated digital technology platforms worldwide.
Intel has a very low debt (total debt to equity is only 0.24) and it has a low trailing P/E of 13.54 and a low forward P/E of 13.23. The average annual earnings growth estimates for the next five years is at 5%. The forward annual dividend yield is quite high at 3.59%, and the payout ratio is only 47.3%. The annual rate of dividend growth over the past three years was quite high at 13.58%, and over the past five years, was also high at 11.55%.
The INTC stock price is 2.97% above its 20-day simple moving average, 3.86% above its 50-day simple moving average and 8.70% above its 200-day simple moving average. That indicates a short-term, a mid-term and a long-term uptrend.
Intel has recorded strong revenue, EPS and dividend growth, during the last three years and the last five years, as shown in the table below.

The tables below emphasize Intel's superiority in terms of margins, return on capital and valuation over its industry median, its sector median and the S&P 500 median.
(click to enlarge)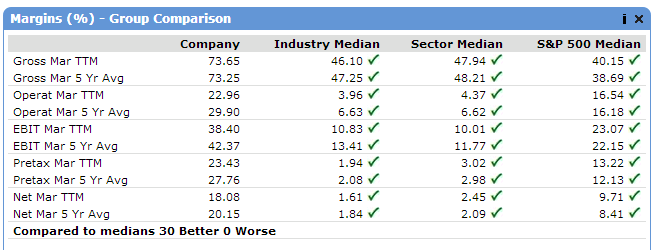
(click to enlarge)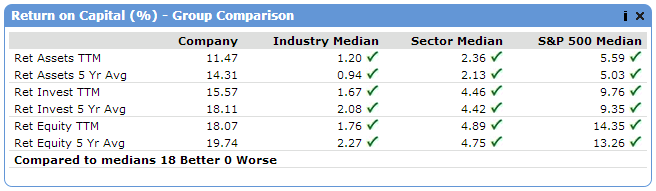
(click to enlarge)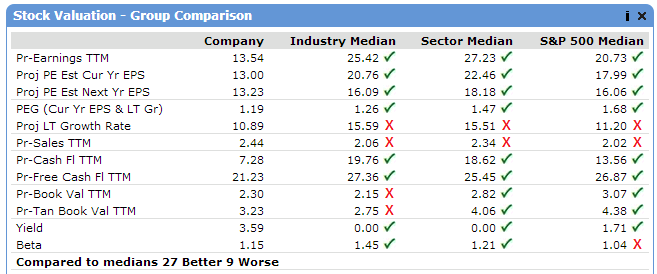
On October 15, Intel reported its third-quarter 2013 financial results, which beat EPS expectations by $0.05. The company reported third-quarter revenue of $13.5 billion, operating income of $3.5 billion, net income of $3.0 billion and EPS of $0.58. The company generated approximately $5.7 billion in cash from operations, paid dividends of $1.1 billion, and used $536 million to repurchase 24 million shares of stock.
Third-Quarter Highlights
- Total revenue up 5 percent sequentially, flat year-over-year
- Record Data Center Group revenue of $2.9 billion, up 12 percent year-over-year
- Launched 4th Generation Intel® Core™ products enabling fanless, innovative tablet and 2 in 1 designs
- More than forty 22nm products introduced for ultra-mobile device, networking, storage, and server market segments
Intel has recorded revenue, EPS and dividend growth, and considering its cheap valuation metrics, and the fact that the stock is in an uptrend, INTC stock can move higher. Furthermore, the rich growing dividend represents a nice income.
(click to enlarge)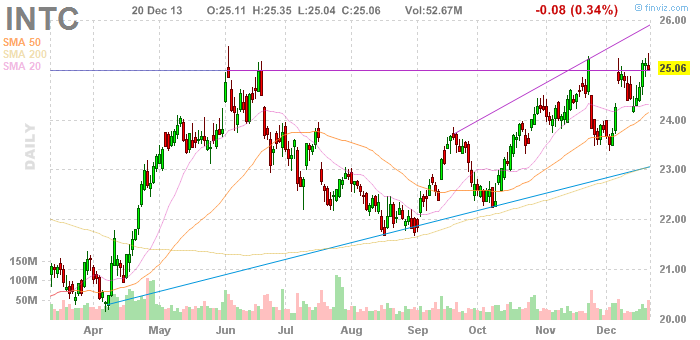
Chart: finviz.com
Lexmark International Inc. (LXK)
Lexmark International, Inc. engages in the development, manufacture, and supply of printing, imaging, device management, managed print services, document workflow, business process, and content management solutions in North and South America, Europe, the Middle East, Africa, Asia, the Pacific Rim, and the Caribbean.
Lexmark has a low trailing P/E of 14.17 and a very low forward P/E of 9.45. The price-to-sales ratio is very low at 0.60, and the price-to-cash ratio is also very low at 2.26. The price to free cash flow is very low at 13.12, and the current ratio is at 1.80. The forward annual dividend yield is quite high at 3.43%, and the payout ratio is only 47.94%.
Most of Lexmark's margins, return on capital, stock valuation and efficiency parameters have been better than its industry median, sector median and the S&P 500 median, as shown in the tables below.
(click to enlarge)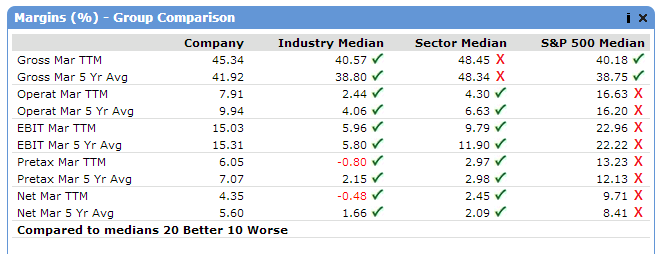
(click to enlarge)
(click to enlarge)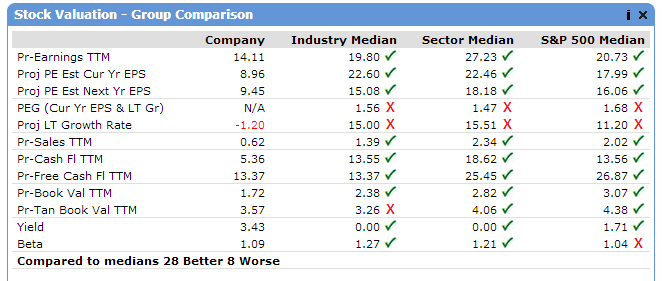
(click to enlarge)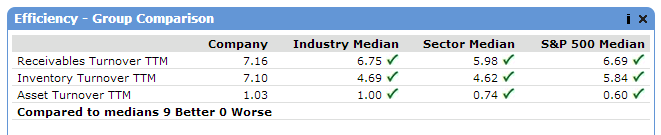
On October 22, Lexmark reported its third-quarter 2013 financial results, which beat EPS expectations by $0.04 and beat on revenues.
Third-Quarter Highlights
- Revenue, excluding Inkjet Exit, grew 5 percent
- Record Managed Print Services revenue grew 18 percent
- Perceptive Software GAAP revenue grew 32 percent (non-GAAP 38 percent)
- Revenue exceeded guidance range, EPS at top of range
- Free cash flow generation of $98 million
- Share repurchases and dividends totaled $40 million
- Strengthened software solutions with two acquisitions
Lexmark has compelling valuation metrics, and it s returning value to its shareholders by share repurchases and by increasing dividend payments. In my opinion, LXK stock can move higher. Furthermore, the rich dividend represents a nice income.
(click to enlarge)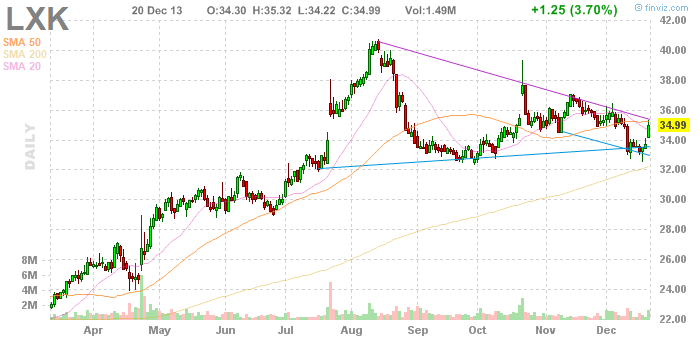
Chart: finviz.com
Cisco Systems, Inc. (CSCO)
Cisco Systems, Inc. designs, manufactures, and sells Internet protocol and other products related to the communications and information technology industry worldwide.
Cisco Systems has a low debt (total debt to equity is only 0.28), and it has a very low trailing P/E of 11.48 and even a lower forward P/E of 10.17. The price to free cash flow for the trailing 12 months is very low at 13.55, and the average annual earnings growth estimates for the next five years is at 8.38%. The current ratio is quite high at 2.90, and the price-to-cash ratio is very low at 2.36. The forward annual dividend yield is at 3.22%, and the payout ratio is only 35.2%.
Cisco has recorded EPS and revenue growth, during the last year, the last three years and the last five years, as shown in the table below.

Cisco's margins and return on capital parameters have been much better than those of the industry median, the sector median, and the S&P 500 median, as shown in the tables below.
(click to enlarge)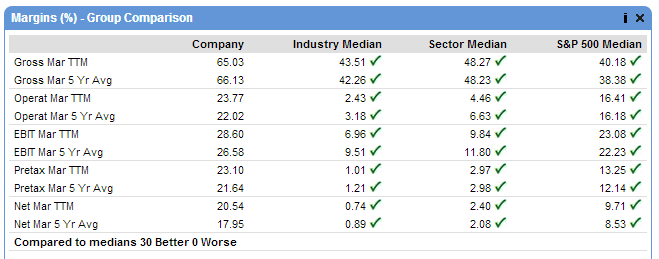
(click to enlarge)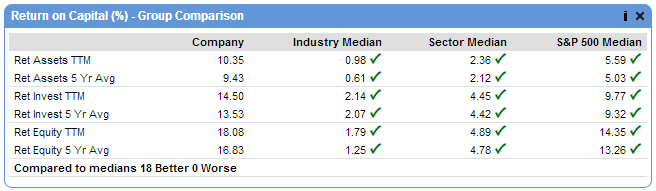
Most of Cisco's stock valuation parameters have been much better than those of the industry median, the sector median and the S&P 500 median, as shown in the table below.
(click to enlarge)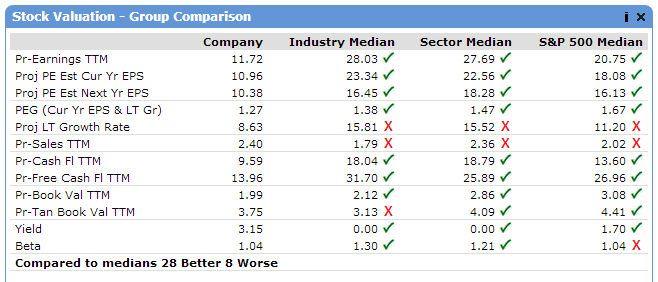
On November 13, Cisco Systems reported its first-quarter fiscal 2014 financial results, which beat EPS expectations by $0.02. Cisco reported first quarter revenue of $12.1 billion, net income on a generally accepted accounting principles [GAAP] basis of $2.0 billion or $0.37 per share, and non-GAAP net income of $2.9 billion or $0.53 per share. In the report, Cisco Chairman and CEO John Chambers said:
This quarter we delivered record non-GAAP profitability and continued our steady stream of innovation and market leadership. While our revenue growth was below our expectation, our financials are strong, our strategy is strong and our innovation engine is executing extremely well. We remain confident in our long-term goal to be the #1 IT company in the world and help our customers solve their biggest business problems.
Stock Repurchase Program Expanded
Cisco is also announcing that its board of directors authorized up to $15 billion in additional repurchases of its common stock. Cisco's board had previously authorized up to $82 billion in stock repurchases. There is no fixed termination date for the repurchase program. The remaining authorized amount for stock repurchases under this program, including the additional authorization, is approximately $16.1 billion.
Cisco has compelling valuation metrics and good earnings growth prospects, and considering the expanded repurchase program, CSCO stock can move higher. Furthermore, the rich dividend represents a nice income.
(click to enlarge)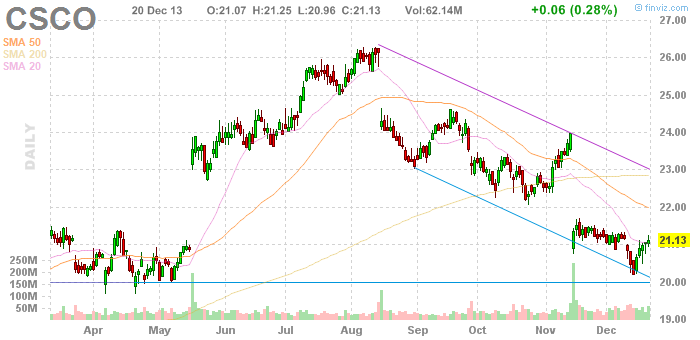
Chart: finviz.com
Seagate Technology Plc (STX)
Seagate Technology designs, manufactures, markets, and sells hard disk drives for enterprise storage, client compute, and client non-compute market applications worldwide.
Seagate Technology has a very low trailing P/E of 12.36 and a very low forward P/E of 9.41.The price-to-sales ratio is at 1.42, and the price to free cash flow for the trailing 12 months is very low at 14.42. The forward annual dividend yield is quite high at 3.09%, and the payout ratio is only 31.3%. The annual rate of dividend growth over the past five years was very high at 27.01%.
The STX stock price is 10.90% above its 20-day simple moving average, 13.94% above its 50-day simple moving average and 32.19% above its 200-day simple moving average. That indicates a very strong short-term, mid-term and long-term uptrend.
Seagate Technology has recorded strong EPS and dividend growth and moderate revenue growth, during the last five years, as shown in the table below.

On October 28, Seagate Technology reported its fiscal first quarter 2014 financial results, which missed EPS expectations by $0.01. The company reported revenue of approximately $3.5 billion, gross margin of 28.0%, net income of $427 million and diluted earnings per share of $1.16. On a non-GAAP basis, which excludes the net impact of certain items, Seagate reported gross margin of 28.5%, net income of $473 million and diluted earnings per share of $1.29. In the report, Steve Luczo, Seagate's chairman and chief executive officer, said:
The solid financial results we achieved this quarter reflect the ongoing execution of our business model. While the challenges of technology transitions and macro uncertainty are driving us to manage our business conservatively, we remain focused on the fact that the demand for exabytes of storage continues to increase. We continue to invest in our market-leading storage technology portfolio to enable cloud, mobile and open source storage advancement as we believe these market trends represent new and significant opportunities for Seagate.
Seagate Technology has compelling valuation metrics, and considering that the stock is in an uptrend, STX stock can move higher. Furthermore, the rich growing dividend represents a nice income.
Risks to the expected capital gain include a downturn in the U.S. economy, and weakness in the consumer electronics market.
(click to enlarge)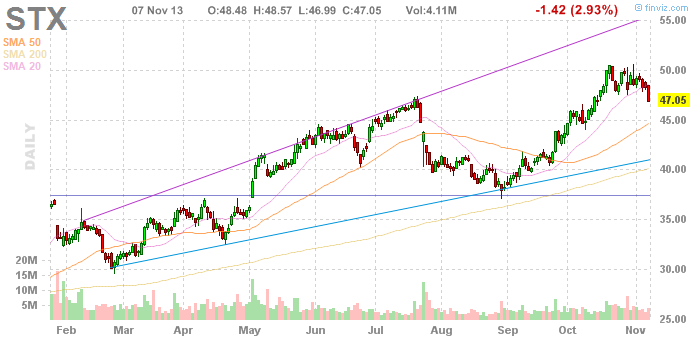
Chart: finviz.com
Microsoft Corporation (MSFT)
Microsoft Corporation develops, licenses, and supports software, services, and hardware devices worldwide.
Microsoft has a low debt (total debt to equity is only 0.20), and it has a very low trailing P/E of 13.78 and a lower forward P/E of 12.71. The PEG ratio is at 1.92, and the average annual earnings growth estimates for the next five years is at 7.18%. The forward annual dividend yield is at 3.04%, and the payout ratio is only 34%. The annual rate of dividend growth over the past three years was very high at 21.02% and over the past five years was also very high at 15.95%.
The MSFT stock price is 0.96% above its 50-day simple moving average and 11.33% above its 200-day simple moving average. That indicates a mid-term and a long-term uptrend.
Microsoft has recorded strong EPS, revenue and dividend growth, during the last year, the last three years and the last five years, as shown in the table below.

Microsoft's margins and return on capital parameters have been much better than those of the industry median, the sector median, and the S&P 500 median, as shown in the tables below.
(click to enlarge)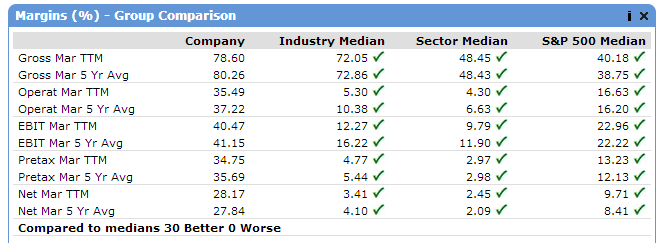
(click to enlarge)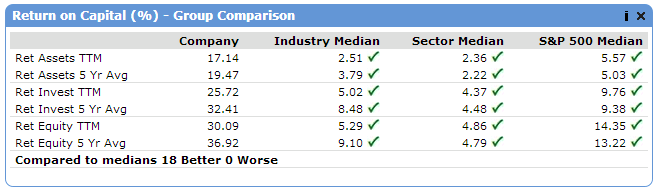
Most of Microsoft's stock valuation parameters have been much better than those of the industry median, the sector median and the S&P 500 median, as shown in the table below.
(click to enlarge)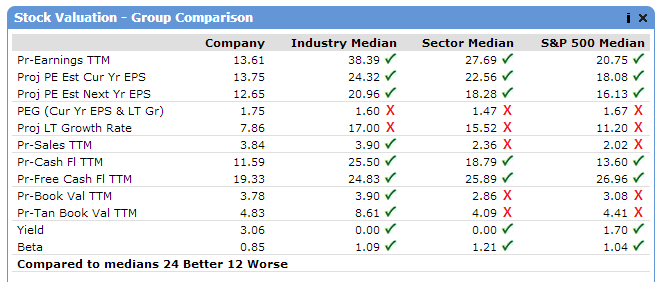
On October 24, Microsoft reported its first-quarter fiscal 2014 financial results, which beat EPS expectations by $0.08. The company reported revenue of $18.53 billion for the quarter ended September 30, 2013. Gross margin, operating income, net income, and diluted earnings per share for the quarter were $13.42 billion, $6.33 billion, $5.24 billion, and $0.62 per share. In the report, Steve Ballmer, chief executive officer at Microsoft said:
Our devices and services transformation is progressing and we are launching a wide range of compelling products and experiences this fall for both business and consumers. Our new commercial services will help us continue to outgrow the enterprise market, and we are seeing lots of consumer excitement for Xbox One, Surface 2 and Surface Pro 2, and the full spectrum of Windows 8.1 and Windows Phone devices.
Microsoft has recorded strong EPS, revenue and dividend growth, and considering its compelling valuation metrics, and the fact that the stock is in an uptrend, MSFT stock can move higher. Furthermore, the rich growing dividend represents a nice income.
(click to enlarge)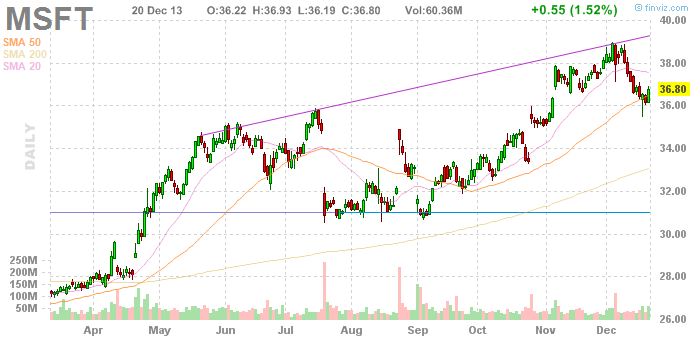
Chart: finviz.com
CA Inc. (CA)
CA, together with its subsidiaries, provides enterprise information technology management software and solutions that help customers manage and secure IT environments in the United States and internationally.
CA has a very low debt (total debt to equity is only 0.31), and it has a very low trailing P/E of 14.07 and a very low forward P/E of 12.79. The price to free cash flow for the trailing 12 months is at 24.47, and the average annual earnings growth estimates for the next five years is quite high at 13.50%. The PEG ratio is very low at 0.79. The forward annual dividend yield is at 3.04%, and the payout ratio is only 42.7%. The annual rate of dividend growth over the past three years was very high at 84.65% and over five years was also very high at 44.27%.
The CA stock price is 0.61% above its 20-day simple moving average, 3.82% above its 50-day simple moving average and 14.92% above its 200-day simple moving average. That indicates a short-term, a mid-term and a long-term uptrend.
CA has recorded strong EPS and dividend growth, and moderate revenue growth, during the last year, the last three years and the last five years, as shown in the table below.

The tables below emphasize CA's superiority in terms of margins, return on capital and valuation over its industry median, its sector median and the S&P 500 median.
(click to enlarge)
(click to enlarge)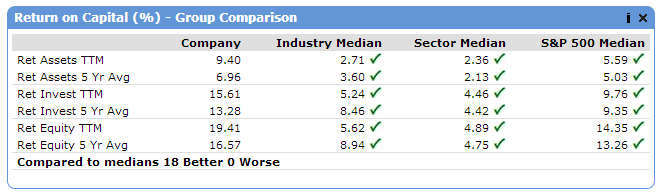
(click to enlarge)
On October 24, CA reported its second-quarter fiscal year 2014 financial results. EPS came in at $0.73 a $0.13 better than analyst expectations; the company beat also on revenues.
Second-Quarter Highlights
- GAAP EPS Grows 8 Percent in Constant Currency and 10 Percent as Reported
- Non-GAAP EPS Grows 46 Percent in Constant Currency and as Reported
- Revenue Flat in Constant Currency and Down 1 Percent as Reported
- Cash Flow From Operations Declines 7 Percent in Constant Currency and 2 Percent as Reported
- Updates FY 2014 Outlook for Revenue and GAAP and Non-GAAP EPS
CA has recorded revenue, EPS and dividend growth, and considering its compelling valuation metrics, and its good earnings growth prospects, CA stock can move higher. Furthermore, the rich growing dividend represents a nice income.
(click to enlarge)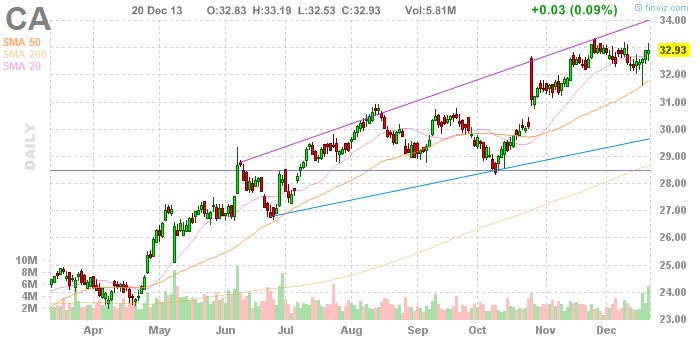
Chart: finviz.com
Disclosure: I am long CA, INTC, MSFT, STX. I wrote this article myself, and it expresses my own opinions. I am not receiving compensation for it (other than from Seeking Alpha). I have no business relationship with any company whose stock is mentioned in this article. (More...)
This entry passed through the Full-Text RSS service — if this is your content and you're reading it on someone else's site, please read the FAQ at fivefilters.org/content-only/faq.php#publishers.
Aucun commentaire:
Enregistrer un commentaire